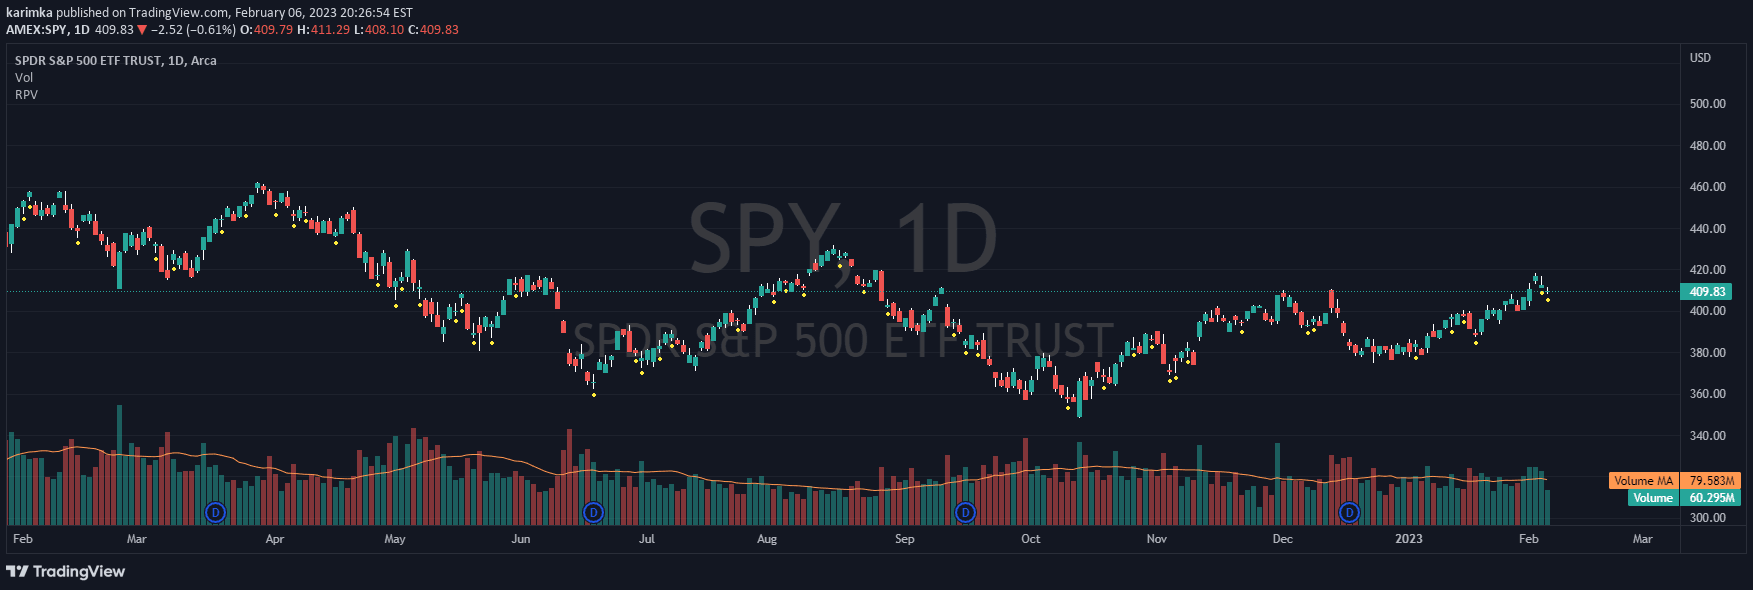
A volume and compression indicator that reveals market dynamics by analyzing trading volume relative to price movement, helping traders identify potential trend shifts and institutional activity.
Explore complementary indicator rolesHow it works
The Volume & Compression Indicator generates two key metrics for each trading candle: the Volume Ratio and the Compression Ratio. The Volume Ratio compares current candle volume to recent average volume, revealing relative trading intensity. When volume exceeds 9.9 times the average, the indicator displays directional arrows to signal extreme volume.
The Compression Ratio measures the relationship between volume and price movement, indicating how effectively volume translates into price changes. Low compression suggests significant price movement with high volume, while high compression indicates substantial volume with minimal price action. Visual cues like dots and color gradients help traders quickly identify accumulation phases and potential market turning points.
Why it may be useful
This indicator provides critical insights into market dynamics by revealing the underlying strength and momentum of price movements. By quantifying volume relative to price action, traders can distinguish between genuine trend movements and potential false signals. The metrics help identify periods of institutional activity and market sentiment that might not be apparent from price alone.
Understanding volume and compression can significantly enhance trading decision-making by offering deeper market insights. Traders can use these metrics to confirm trend strength, detect potential reversals, and gauge the authenticity of price movements. The visual cues and numerical indicators provide a comprehensive view of market behavior beyond traditional price charts.
When to explore it
The Volume & Compression Indicator is most effective during periods of market transition, such as potential trend reversals, breakouts, and consolidation phases. Traders should pay close attention when volume spikes above 2.0, as these often signal significant market events or potential directional changes. High compression readings can indicate accumulation phases that might precede substantial price movements.
The indicator works particularly well in volatile markets with clear institutional participation. Traders can use it across various timeframes, from scalping to swing trading, to validate trading signals and understand underlying market dynamics. It is especially valuable when combined with other technical analysis tools to provide a more comprehensive market analysis.
Keep exploring
What we’ve verified
Access, alerts and repainting behaviour have not been independently verified for this indicator. Check the creator’s current publication and settings.
General descriptions and classifications are recovered research. Verified details above identify the specific checks we have completed. Check the creator’s current publication for later changes.