
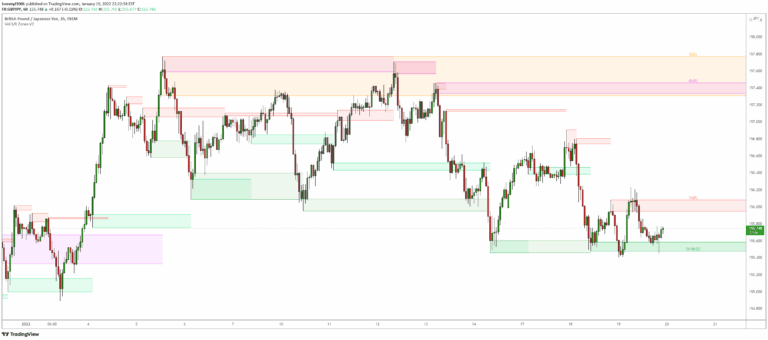
Volume-based Support & Resistance Zones
An advanced Support & Resistance indicator that identifies significant price zones using volume and fractal highs/lows, helping traders visualize potential trend reversals and continuations.
Explore 11,183 indicators. Filter beyond the obvious.
Discover the tools that fit the way you trade.
11,183 tools to explore
An advanced Support & Resistance indicator that identifies significant price zones using volume and fractal highs/lows, helping traders visualize potential trend reversals and continuations.
A multi-timeframe supply and demand indicator that identifies trading zones based on momentum candles, helping traders recognize potential support and resistance levels.
A daily indicator identifying supply and demand areas using market data, highlighting potential support and resistance levels based on price and volume interactions.
An anchored supply and demand indicator that allows traders to manually select price range zones to analyze volume distribution and potential support/resistance levels.
A Smart Money Concepts trading indicator that identifies demand and supply zones, highlighting key liquidity levels and price structure changes across multiple timeframes.
A dynamic trading indicator that automatically identifies supply and demand zones, helping traders detect potential price reversal areas by analyzing market volume and pivot points.
A psychological support/resistance indicator that identifies potential price reaction zones based on sequential candle movements and provides hypothetical support and resistance levels.
A technical indicator that identifies areas of strong buying and selling pressure by calculating price deltas and using standard deviation to highlight significant market activity zones.
An indicator that identifies institutional buy and sell order zones by tracking price action imbalances, helping traders anticipate potential market reversals and significant price movements.
An order block indicator that identifies key price accumulation zones, helping traders spot potential entry and exit points by highlighting supply and demand areas on the chart.
A technical analysis tool that automatically identifies static and dynamic support and resistance levels across short and long-term intervals to help traders predict potential price reversals and continuations.
A multi-timeframe supply and demand indicator that identifies key trading zones across different time frames, allowing customizable analysis of potential price reversal and continuation areas.
Likes, views, and comments are historical TradingView snapshots. They describe attention, not trading performance.