Hourly Trading System (Zeiierman)
A comprehensive hourly trading system that plots key price levels, identifies trend direction, and highlights potential entry and exit points across different timeframes.
Explore 11,183 indicators. Filter beyond the obvious.
Discover the tools that fit the way you trade.
11,183 tools to explore
A comprehensive hourly trading system that plots key price levels, identifies trend direction, and highlights potential entry and exit points across different timeframes.
An experimental trading signal applying the Logistic Map Equation to popular indicators like Awesome Oscillator, ROC, RSI, and Stochastic to generate unique market insights through iterative mathematical calculations.
A price action scalping sequence identifying potential breakout opportunities by detecting two unsuccessful breakouts in the same direction, anticipating a third decisive move.
A multi-harmonic trigonometric model that extrapolates price trends using Fourier series and Quinn-Fernandes algorithm for predicting future price movements and cycles.
A market analysis tool that calculates probabilities of price tops and bottoms across various time periods, offering traders strategic insights into market timing and potential trend reversals.
A signal generator that creates range and equivalent levels across different timeframes, automatically removing duplicate levels and prioritizing higher timeframe information for clearer market perspectives.
The Sequencer is an advanced indicator that identifies potential price reversals by tracking sequential price movements across two customizable phases: preparation and lead-up.
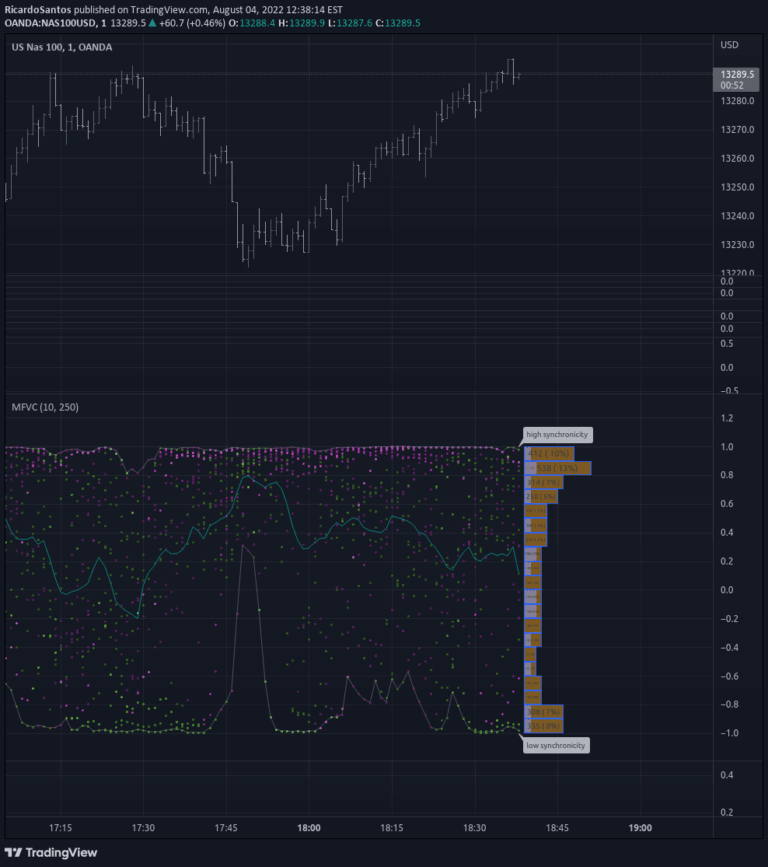
A complex indicator analyzing the relationship between trading volume and price volatility, using color intensity to represent window length and volatility direction.
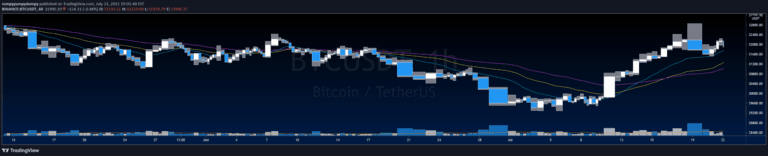
EquiVolume is a charting method that integrates volume information into candlestick charts by adjusting candle width based on trading volume, providing visual insights into market activity.
A quantitative price forecasting indicator that analyzes past price data to predict future movements, calculate probabilities, and highlight potential trading opportunities using mean-reverting logic.
An adaptive momentum oscillator using Hilbert Transform to detect market cycles and provide dynamic insights into trend shifts, overbought/oversold conditions, and potential price reversals.
An addon for TradingView that displays volume bars alongside Equivolume bars, enhancing volume visualization and analysis for traders seeking comprehensive market insights.
Likes, views, and comments are historical TradingView snapshots. They describe attention, not trading performance.