YOUR INDICATOR RESEARCH STARTS HERE

Find the right indicator.
Understand what it does.

Explore 11,183 indicators. Filter beyond the obvious.
Discover the tools that fit the way you trade.

THE INDICATOR LIBRARY

Results for “FUN”

11,183 tools to explore

536 indicators matching your filters
Save search
LevelsSignal

Quarterly Earnings

by finallynitin

A TradingView script that displays quarterly earnings per share and sales data with year-on-year percentage changes, offering customizable visualization of financial performance metrics.

Main price chart · unverifiedSwing Trading
Explore
3.7Klikes44.7Kviews66comments
Save
MomentumTrend

RS Rating

by Fred6724

The RS Rating evaluates a stock's price performance relative to the market over 52 weeks, helping traders identify stocks that are outperforming and potentially poised for further gains.

Separate pane · unverifiedDay Trading · Swing Trading
Explore
3.4Klikes45.4Kviews223comments
Save
TrendMomentumEditor’s pick

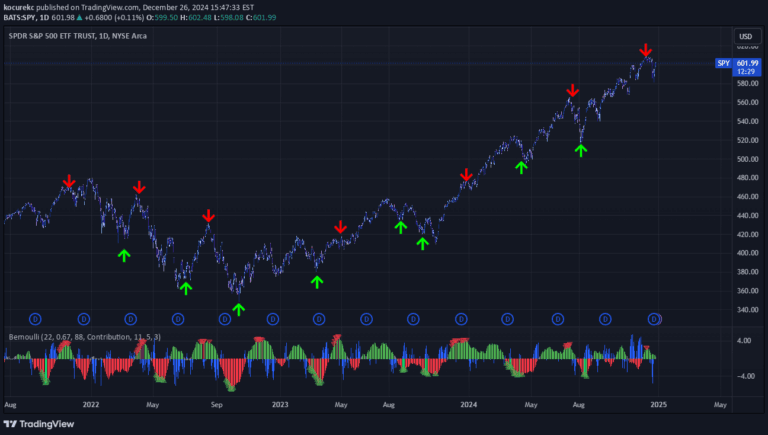
Bernoulli Process - Binary Entropy Function

by kocurekc

A binary entropy function using price and volume to measure information content and generate trading signals based on statistical measurement of market movements and potential trend shifts.

Separate pane · unverifiedDay Trading · Swing Trading
Explore
3Klikes53.6Kviews53comments
Save
VolumeTrendSignal

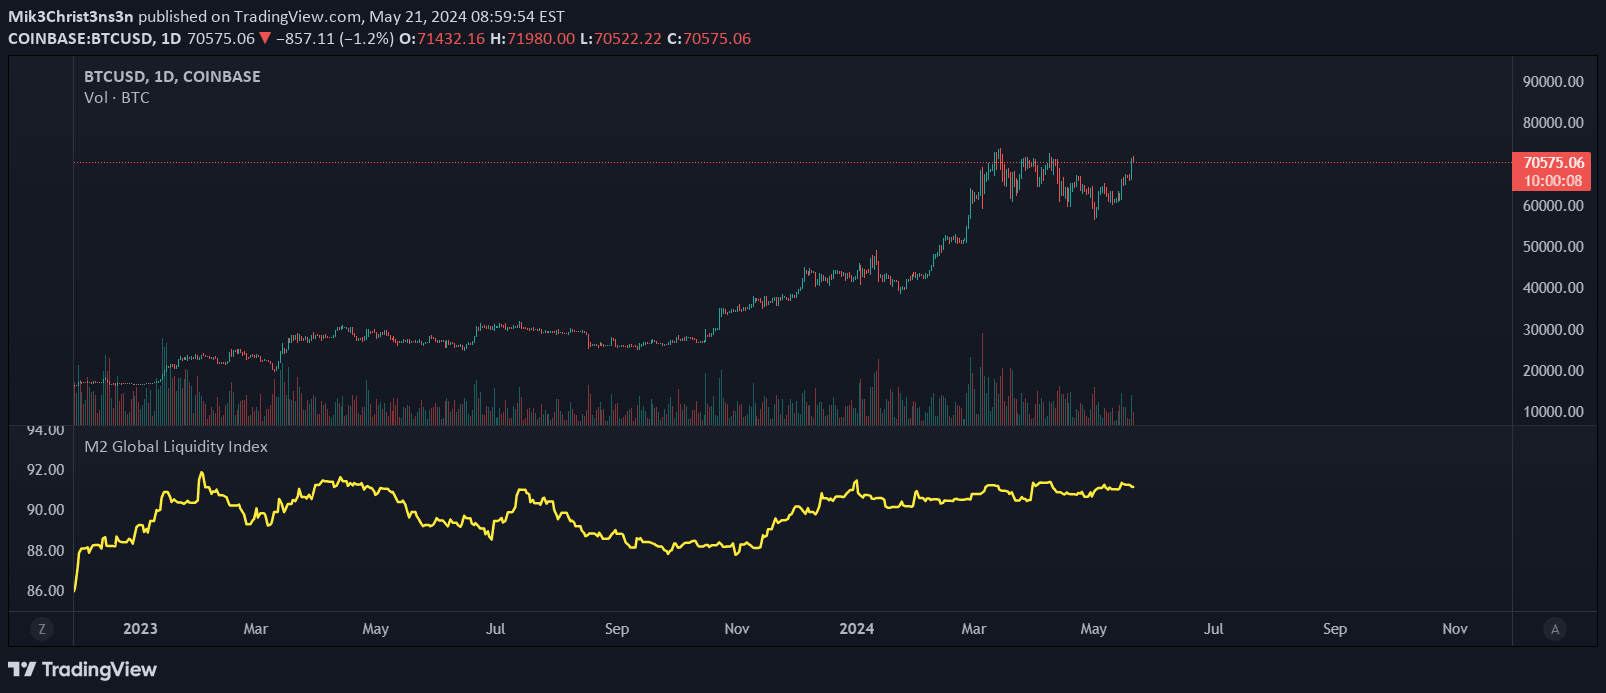
M2 Global Liquidity Index

by Mik3Christ3ns3n

The M2 Global Liquidity Index tracks aggregate money supply across five major currencies, providing a comprehensive view of global economic liquidity and potential market trends.

Separate pane · unverifiedSwing Trading
Explore
2.8Klikes72.7Kviews0comments
Save
VolumeTrendEditor’s pick

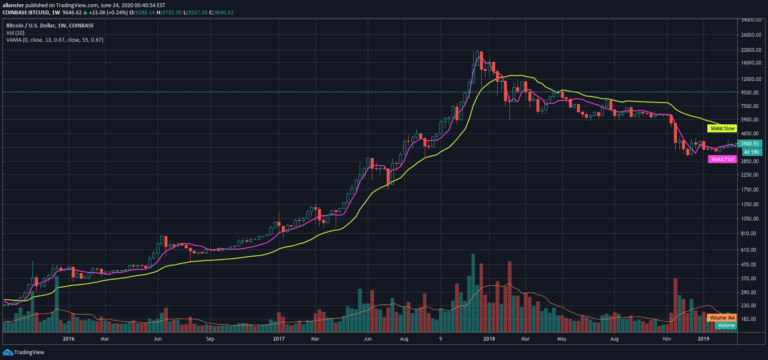
VAMA Volume Adjusted Moving Average Function

by allanster

Volume Adjusted Moving Average (VAMA) is an advanced indicator that calculates moving averages based on volume increments rather than traditional time-based methods, offering a unique perspective on price trends.

Main price chart · unverifiedDay Trading · Swing Trading
Explore
2.8Klikes64.8Kviews36comments
Save
TrendMomentumEditor’s pick

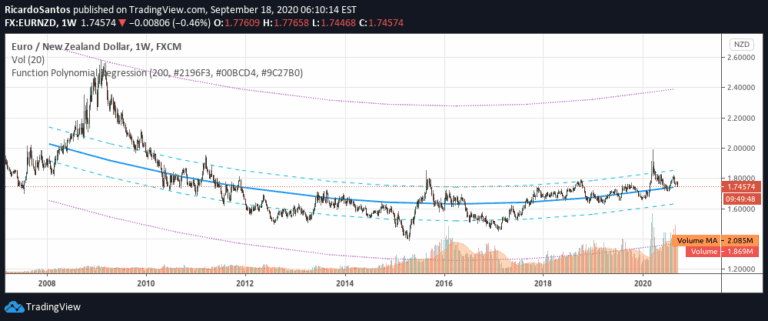
Function Polynomial Regression

by RicardoSantos

A polynomial regression function that analyzes data points to provide predictions, deviations, and statistical insights about trend and momentum patterns in financial datasets.

Main price chart · unverifiedDay Trading · Swing Trading
Explore
2.8Klikes40.5Kviews59comments
Save
Editor’s pick

Financials on Chart

by TradingView

A comprehensive financial indicator that displays up to 9 fundamental metrics from income statements, balance sheets, cash flow, and financial statistics directly on your trading chart.

Main price chart · unverifiedDay Trading · Swing Trading
Explore
2.4Klikes50.9Kviews49comments
Save

Likes, views, and comments are historical TradingView snapshots. They describe attention, not trading performance.

START WITH A QUESTION

A little less searching.
A lot more understanding.

Tell DeepAlpha what you need. Get an explanation, a shortlist,
and a direct path to the indicators behind it.

Ask DeepAlpha