Boom Hunter Pro
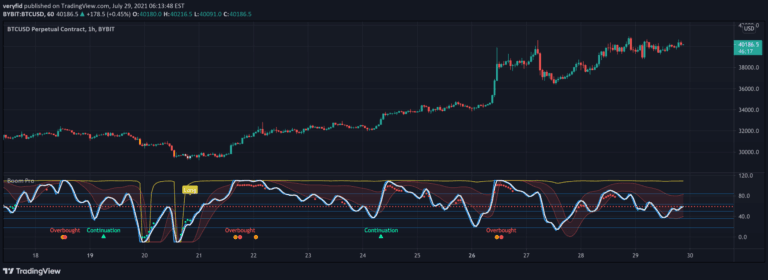
Boom Hunter Pro is an advanced trading indicator using Ehlers Early Onset Trend oscillator to identify potential long entries and short opportunities across different timeframes.
Explore 11,183 indicators. Filter beyond the obvious.
Discover the tools that fit the way you trade.
11,183 tools to explore
Boom Hunter Pro is an advanced trading indicator using Ehlers Early Onset Trend oscillator to identify potential long entries and short opportunities across different timeframes.
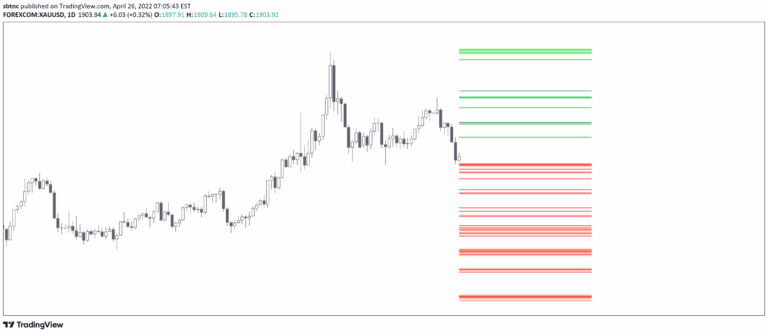
A trading indicator that uses pivot points to identify supply and demand zones, market structure, and potential trading opportunities through visual analysis of price action.
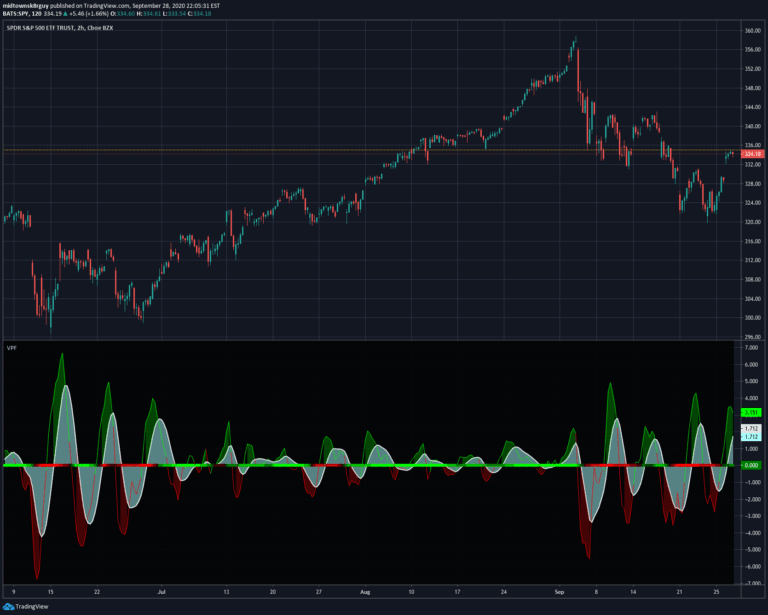
Laguerre RSI is a noise-reduced momentum indicator using John EHLERS' Laguerre Filter to analyze market trends by tracking price movement smoothness and potential reversals.
A generalized Gaussian filter that smooths price data with variable pole orders, reducing noise and high-frequency market movements using advanced signal processing techniques.
A liquidity indicator that identifies potential market order zones by mapping swing highs and lows, revealing where stop-loss orders and significant liquidity pools are likely positioned.
A range-based indicator that highlights price ranges to help identify potential breakouts and trading opportunities by visually marking key price levels and market movements.
A trading script that projects future pivot points by analyzing historical price patterns and calculating potential next pivot locations using statistical analysis of market movements.
A trading indicator that identifies untapped liquidity levels across different timeframes, helping traders understand potential price movement magnets and liquidity pools in the market.
A technical indicator that highlights previous day's high and low points, uses daily and weekly separators to create a clean chart that helps traders understand potential market direction.
A trading signal using Kadane's algorithm to identify the largest market impulse within a window, then applying Murrey's math lines to map potential price movements and trading opportunities.
The RS Rating evaluates a stock's price performance relative to the market over 52 weeks, helping traders identify stocks that are outperforming and potentially poised for further gains.
A multi-indicator trading tool that uses Ehlers' bandpass filter and Voss predictor to anticipate potential cyclic turning points in market price movements.
Likes, views, and comments are historical TradingView snapshots. They describe attention, not trading performance.