2B Reversal Pattern (Expo)
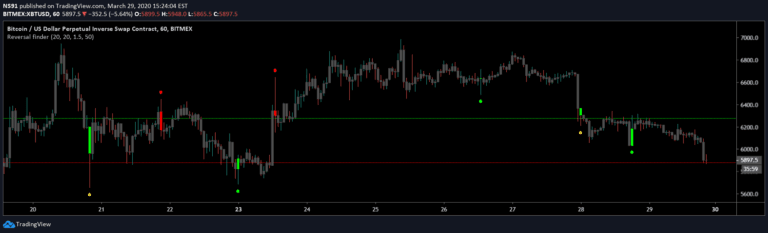
The 2B reversal pattern identifies potential market trend reversals by detecting false breakouts and price rebounds, signaling opportune entry points for traders.
Explore 11,183 indicators. Filter beyond the obvious.
Discover the tools that fit the way you trade.
11,183 tools to explore
The 2B reversal pattern identifies potential market trend reversals by detecting false breakouts and price rebounds, signaling opportune entry points for traders.
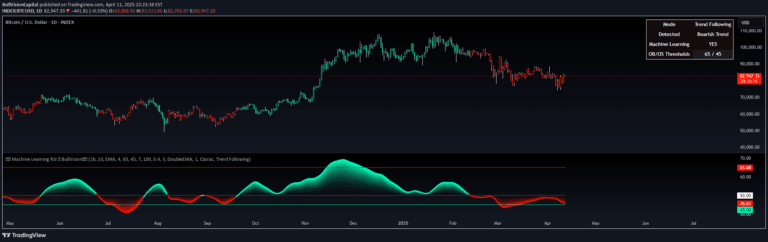
A sophisticated RSI indicator that uses machine learning and K-Nearest Neighbors to dynamically adapt momentum analysis by comparing current market conditions with historical patterns.
A trading signal using Kadane's algorithm to identify the largest market impulse within a window, then applying Murrey's math lines to map potential price movements and trading opportunities.
A trading indicator that detects breakouts from previous higher timeframe high and low levels, providing take-profit and stop-loss levels with advanced filtering for false breakouts.
A trading signal that identifies potential price reversals by analyzing false breakouts of support and resistance levels through range and position analysis of price bars.
A trend-following system that uses volatility-scaled steps to track market momentum, visualizing trend progression through discrete channels and adaptive volatility bands.
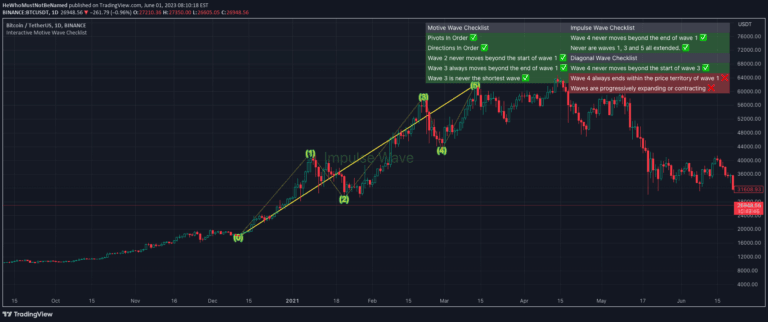
Elliott Wave analysis is a technical trading method that identifies market trends by examining price wave patterns, helping traders predict potential market movements and trend reversals.
ICT Turtle Soup is a trading strategy that exploits false breakouts in liquidity zones by identifying precise market structure shifts and potential reversal points across different markets.
Portfolio Backtester Engine (PBTE) allows traders to backtest strategies across multiple securities simultaneously, providing comprehensive performance analysis and robust strategy validation.
A volume-based trading tool that identifies high-impact candles and reveals hidden liquidity zones by analyzing microstructure data across different timeframes.
An advanced indicator that identifies significant price movements with volume confirmation, creating dynamic supply and demand zones to highlight potential market momentum and trading opportunities.
False Breakout is a technical analysis method identifying price movements that momentarily break key levels but quickly reverse, offering strategic trading opportunities.
Likes, views, and comments are historical TradingView snapshots. They describe attention, not trading performance.