3Commas Bot
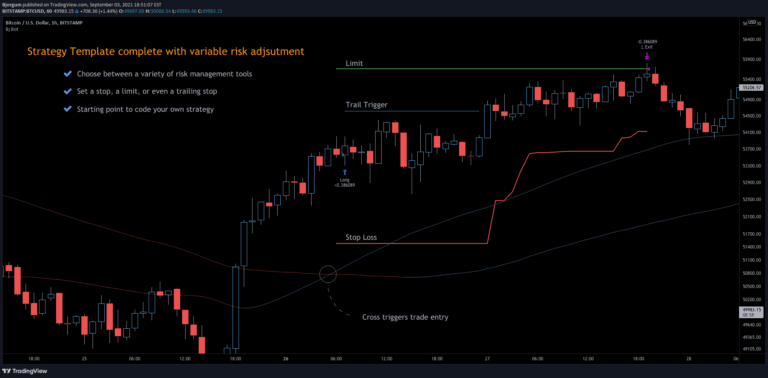
A 3Commas TradingView bot strategy offering automated trading with risk management, using moving average crossovers and customizable stop-loss and limit order settings.
Explore 11,183 indicators. Filter beyond the obvious.
Discover the tools that fit the way you trade.
11,183 tools to explore
A 3Commas TradingView bot strategy offering automated trading with risk management, using moving average crossovers and customizable stop-loss and limit order settings.
A multi-timeframe supply and demand indicator that identifies trading zones based on momentum candles, helping traders recognize potential support and resistance levels.
An anchored supply and demand indicator that allows traders to manually select price range zones to analyze volume distribution and potential support/resistance levels.
An indicator that identifies institutional buy and sell order zones by tracking price action imbalances, helping traders anticipate potential market reversals and significant price movements.
An order block indicator that identifies key price accumulation zones, helping traders spot potential entry and exit points by highlighting supply and demand areas on the chart.
A hybrid moving average that combines Gaussian and ALMA smoothing techniques with RSI and CMO to generate advanced trend and momentum signals for traders.
A trading strategy focusing on Fair Value Gaps (FVGs) that identifies market imbalances and potential price movement zones based on specific candlestick patterns and market conditions.
A comprehensive market breadth indicator combining McClellan Summation Index with Heikin-Ashi visualization and MACD analysis to provide advanced trend and momentum insights.
A trading strategy identifying key supply and demand zones on price charts to pinpoint potential market reversals and trading opportunities based on historical price reactions.
A pre-market volume indicator that highlights unusual trading activity, signaling potential high price movement by tracking volume deviations from the average.
Mswing is a momentum oscillator measuring price change over 20 and 50 periods, helping traders assess market momentum, relative strength, and potential entry/exit points across different timeframes.
A comprehensive market breadth indicator using McClellan Oscillator, Summation Index, RSI, and MACD to analyze stock market internals and identify potential trend reversals.
Likes, views, and comments are historical TradingView snapshots. They describe attention, not trading performance.