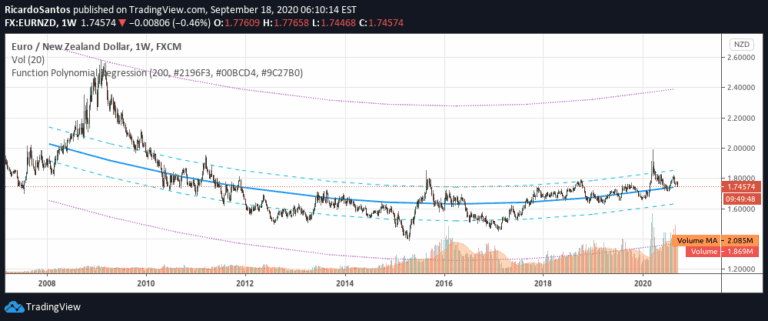
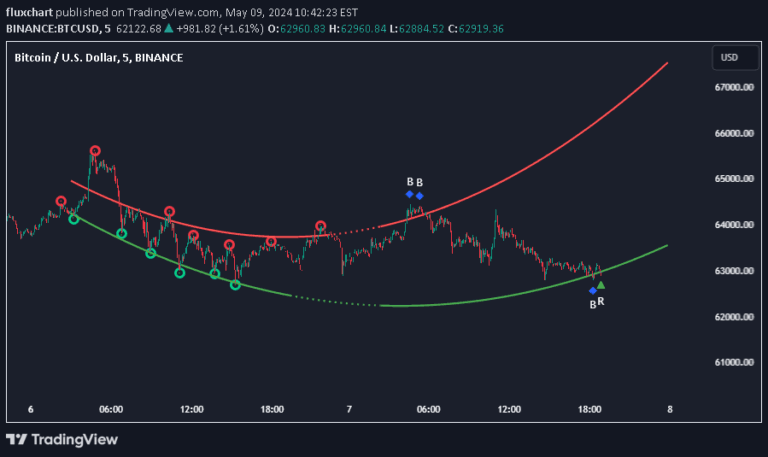
Polynomial Regression Keltner Channel [ChartPrime]
A sophisticated trading indicator combining polynomial regression with dynamic Keltner Channels to analyze market trends, volatility, and potential trading opportunities across multiple timeframes.
Explore 11,183 indicators. Filter beyond the obvious.
Discover the tools that fit the way you trade.
11,183 tools to explore
A sophisticated trading indicator combining polynomial regression with dynamic Keltner Channels to analyze market trends, volatility, and potential trading opportunities across multiple timeframes.
A polynomial regression function that analyzes data points to provide predictions, deviations, and statistical insights about trend and momentum patterns in financial datasets.
A polynomial regression indicator that calculates complex curve-fitting relationships between price variables, enabling advanced trend analysis and least squares moving average (LSMA) generation.
A dynamic support and resistance indicator using polynomial regression to identify price pivot points and potential trend reversal zones with customizable complexity.
A comprehensive trading script that recreates TradingView's watchlist stats panel, offering real-time performance metrics and historical comparisons across multiple timeframes.
A Monte Carlo simulation tool that generates multiple potential future price paths using statistical methods, helping traders visualize potential market scenarios and understand probabilistic price movements.
A volume profile tool using polylines and maps to visualize trading volume across different price levels, offering customizable display and analysis of volume distribution.
A custom speedometer visualization tool that converts complex market data like analyst recommendations and put-call ratios into an intuitive graphical representation of market sentiment and trend.
A Bitcoin price prediction model using polynomial regression that incorporates diminishing returns theory, providing potential cycle tops and bottoms based on historical market data.
Polychromatic Momentum is an advanced momentum indicator that calculates weighted momentum values across multiple time periods, giving more significance to recent price movements.
A custom Pine Script indicator that uses unique coordinate mapping and ATR scaling to draw a graphical representation of Patrick Star on trading charts.
A trading visualization tool that displays Higher TimeFrame (HTF) candles using polylines, allowing traders to see broader market context without switching chart timeframes.
Likes, views, and comments are historical TradingView snapshots. They describe attention, not trading performance.