Point of Control V2
A volume profile indicator that automatically calculates point of control (POC) for different time periods, identifying significant price levels and market structure across various trading timeframes.
Explore 11,183 indicators. Filter beyond the obvious.
Discover the tools that fit the way you trade.
11,183 tools to explore
A volume profile indicator that automatically calculates point of control (POC) for different time periods, identifying significant price levels and market structure across various trading timeframes.
A trading signal identifying divergence between VWAP and RSI, providing potential entry points during strong bullish or bearish trends by analyzing price pullbacks relative to moving averages.
A volume-based trading indicator that identifies potential market trend reversals by analyzing Price Volume Trend (PVT) swing points across customizable lookback periods.
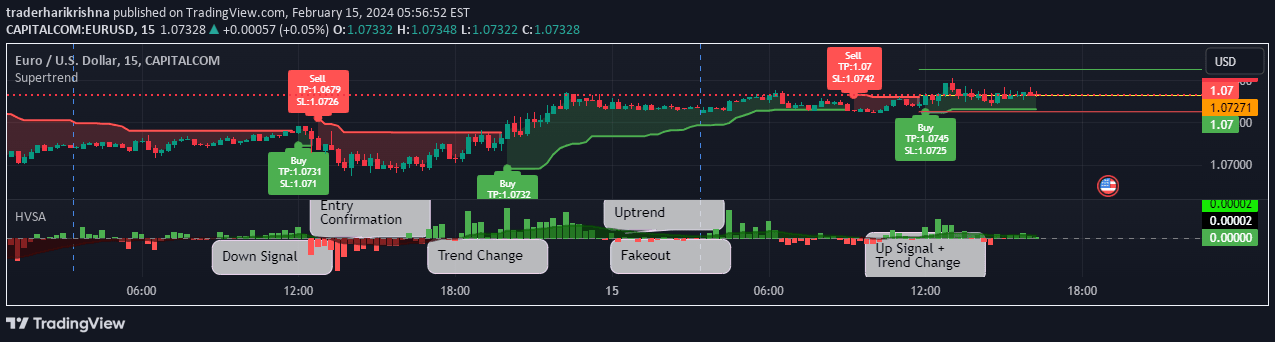
A Volume Spread Analysis indicator that identifies trend direction and volume breakouts by analyzing price, volume changes, and histogram crossovers for potential trading signals.
A specialized indicator that detects high-volume trading bars by comparing current volume against a moving average and customizable volume multiplier settings.
An advanced volume analysis tool that measures volume density across multiple assets, providing insights into market maker activities and liquidity concentration in trading markets.
A comprehensive multi-timeframe trend analysis dashboard that combines multiple technical indicators to provide traders with a clear, concise view of market direction across different time periods.
A TradingView indicator designed to identify sideways or ranging market conditions by analyzing price movement and volatility with customizable sensitivity parameters.
A dynamic trading indicator that combines price action, volume analysis, and trend prediction to forecast potential market movements with confidence bands and volume-based insights.
A comprehensive trading indicator combining volume analysis and custom Xtrender oscillators to identify market trends, momentum shifts, and potential reversals through advanced volume and price action metrics.
Draw on Liquidity (DOL) is an advanced technical analysis tool identifying significant market liquidity zones through volume analysis, pivot detection, and real-time proximity alerts.
An advanced trading indicator that analyzes buy/sell pressure, volume, and market trends using color-coded visual cues and multiple technical analysis techniques.
Likes, views, and comments are historical TradingView snapshots. They describe attention, not trading performance.