Multi TF High/Low/Open/Close Line
A customizable HLOC indicator that allows traders to view multiple timeframe units and lookback periods with configurable line and label settings for enhanced market analysis.
Explore 11,183 indicators. Filter beyond the obvious.
Discover the tools that fit the way you trade.
11,183 tools to explore
A customizable HLOC indicator that allows traders to view multiple timeframe units and lookback periods with configurable line and label settings for enhanced market analysis.
A trading indicator designed to identify bull flag patterns in futures markets, helping traders recognize potential long entry points during upward price movements.
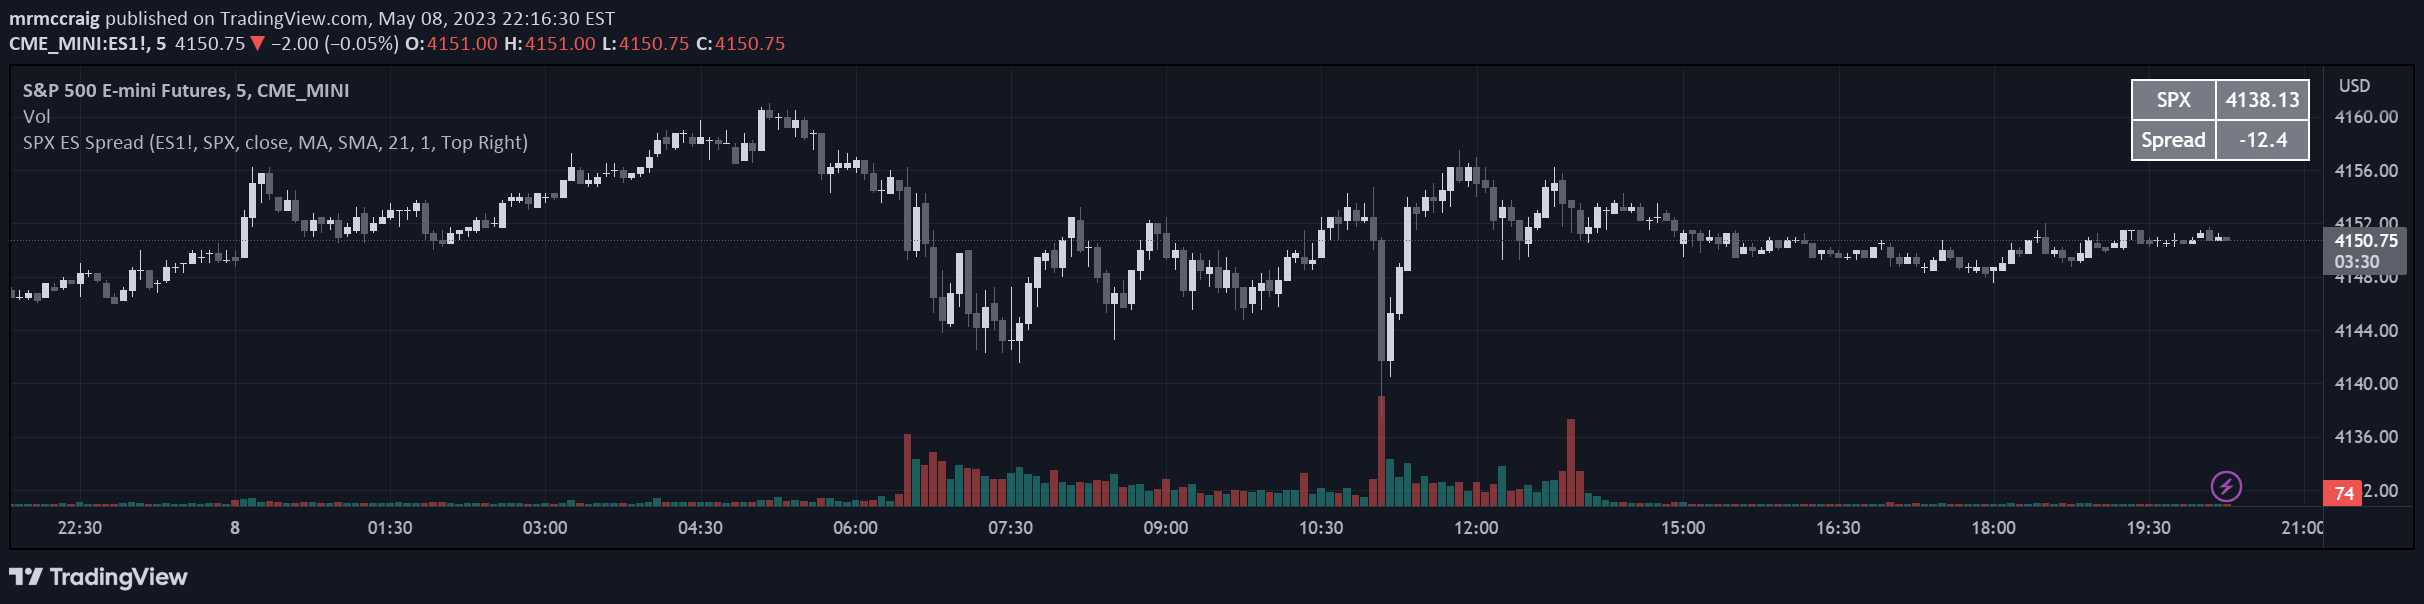
A specialized indicator displaying the price spread between ES and SPX indices, providing real-time comparative tracking for traders monitoring these related market instruments.
The NYSE Tick is a market breadth indicator that measures stock movement direction, helping traders assess short-term market sentiment by comparing stocks ticking up versus down.
A trading indicator that extends mid-lines of candles forward until price revisits the midpoint, tracking potential price action levels across different timeframes.
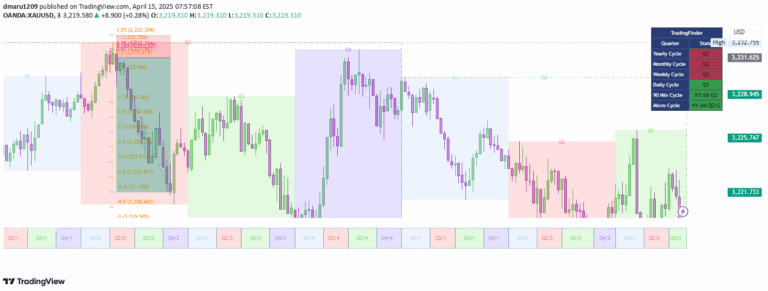
The Quarterly Theory breaks time into fractal segments, providing precise trading reference points across multiple market cycles and timeframes.
An indicator that automatically identifies London and Asia trading session highs and lows, helping traders locate potential liquidity zones and daily trading targets.
A TradingView indicator that monitors trend synchronization across three major U.S. futures indices, helping traders identify market alignment and potential divergence in real-time.
A specialized indicator that generates a reference price for SPY by using the ES E-Mini Futures contract, helping traders analyze market relationships and identify potential trading opportunities.
A position sizing calculator for Micro E-mini S&P 500 Futures that helps traders determine optimal contract quantities based on historical volatility and time-based regression models.
An advanced indicator tracking exponentially weighted correlation between S&P 500 E-mini and 30-Year Treasury Bond futures, revealing dynamic intermarket relationships.
A trading indicator that highlights the previous week's high price on a chart, providing traders with a key reference point for potential support and resistance levels.
Likes, views, and comments are historical TradingView snapshots. They describe attention, not trading performance.