Radius Trend [ChartPrime]
A dynamic technical analysis tool that visualizes market trends using adaptive radius-based bands that adjust to price action and volatility, providing insights into trend direction and strength.
Explore 11,183 indicators. Filter beyond the obvious.
Discover the tools that fit the way you trade.
11,183 tools to explore
A dynamic technical analysis tool that visualizes market trends using adaptive radius-based bands that adjust to price action and volatility, providing insights into trend direction and strength.
A future-trend analysis tool that projects potential price direction by examining three consecutive periods, using price averages and volume delta to forecast market movement.
ICT Silver Bullet Indicator is a comprehensive trading strategy tool that plots market sessions, liquidity points, and provides execution signals based on market structure shifts and fair value gaps.
An advanced trading tool that uses an auto-stepping ladder to help identify trade entries and exits across different trading strategies like trend, momentum, and swing trading.
A trailing exit strategy with multiple profit targets that dynamically adjusts stop loss levels as price moves, designed to optimize trade management and protect potential gains.
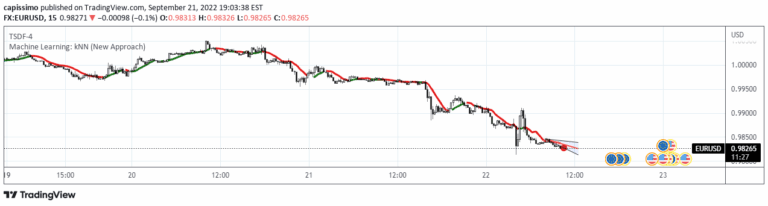
KNN is a machine learning technique predicting next price bar using nearest neighbor data points, providing trend insights by analyzing historical price sequences.
A trend-following system that uses volatility-scaled steps to track market momentum, visualizing trend progression through discrete channels and adaptive volatility bands.
The Corrected Moving Average (CMA) is an adaptive moving average system designed to minimize false signals in sideways markets and provide more accurate trend identification across different market conditions.
A volatility indicator using Z-Score to measure market volatility relative to its mean, helping traders distinguish between trending and consolidating market conditions.
A Pine Script visualization technique that displays multiple moving averages in a 3D format using linefill.new(), allowing customizable MA types, lengths, and color schemes.
Time Segmented Volume is a leading indicator that measures money flow in and out of a financial instrument by analyzing price and volume segments to predict potential trend directions.
A sophisticated session average indicator that estimates market conditions and direction using advanced extrapolation techniques across different market sessions and weighting schemes.
Likes, views, and comments are historical TradingView snapshots. They describe attention, not trading performance.