YOUR INDICATOR RESEARCH STARTS HERE

Find the right indicator.
Understand what it does.

Explore 11,183 indicators. Filter beyond the obvious.
Discover the tools that fit the way you trade.

THE INDICATOR LIBRARY

Results for “Simple Moving Average (SMA)”

11,183 tools to explore

563 indicators matching your filters
Save search
ChannelsSignalTrend

Future Trend Channel [ChartPrime]

by ChartPrime

A dynamic trend channel indicator that identifies market trends, projects future prices, and provides visual signals for potential trade opportunities using SMA and volatility calculations.

Main price chart · unverifiedScalping · Day Trading
Explore
4.5Klikes91Kviews91comments
Save
MomentumTrendVolatility

Multi-Chart Widget [LuxAlgo]

by LuxAlgo

A multi-chart analysis tool enabling traders to simultaneously view multiple financial instruments, technical indicators, and performance metrics across different timeframes.

Main price chart · unverifiedScalping · Day Trading
Explore
3.3Klikes46.1Kviews22comments
Save
TrendEditor’s pick

TF Segmented Linear Regression

by alexgrover

A dynamic trend indicator that fits regression lines at different intervals, revealing market trends and potential price channels by calculating linear trends across specified timeframes.

Main price chart · unverifiedSwing Trading
Explore
3.1Klikes51.4Kviews27comments
Save
TrendEditor’s pick

Previous Period Levels - X Alerts

by JayRogers

A customizable higher time-frame OHLC indicator that provides flexible visual references across multiple resolutions with advanced input options and alert conditions.

Main price chart · unverifiedSwing Trading
Explore
2.5Klikes69.2Kviews56comments
Save
TrendVolatility

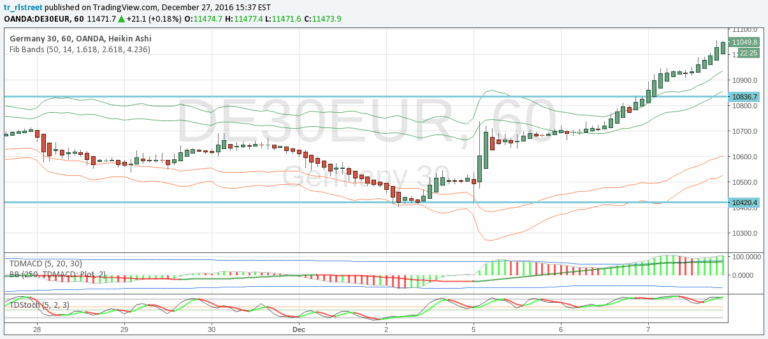
Fibonacci Bands

by rst3612

A Fibonacci-based trading signal using SMA bands to identify short-term reversals in market direction. Helps traders spot potential entry and exit points during ranging market conditions.

Main price chart · unverifiedDay Trading · Swing Trading
Explore
2.3Klikes75.5Kviews18comments
Save
SignalTrend

Trend Change Indicator

by QuantitativeAlpha

A comprehensive trend-following indicator using moving averages to identify bullish and bearish market trends across different timeframes with color-coded visual alerts.

Main price chart · unverifiedDay Trading · Swing Trading
Explore
2.1Klikes48.2Kviews14comments
Save
TrendEditor’s pick

SMA Directional Matrix [LuxAlgo]

by LuxAlgo

A dynamic moving average panel that reveals market sentiment by displaying the direction of multiple moving averages across different time periods, helping traders understand trend dynamics.

Separate pane · unverifiedDay Trading · Swing Trading
Explore
1.9Klikes82.6Kviews23comments
Save
MomentumOscillatorTrend

Double Ribbon [ChartPrime]

by ChartPrime

The Double Ribbon indicator combines two Simple Moving Average ribbons to assess market trends and momentum, providing a visual and quantitative analysis of market direction and strength.

Separate pane · unverifiedScalping · Day Trading
Explore
1.8Klikes26.1Kviews7comments
Save
SignalTrendVolatility

Sentiment Range MA [ChartPrime]

by ChartPrime

A dynamic market sentiment indicator that provides adaptive trend analysis by tracking price movements, offering color-coded insights into market momentum and potential trading opportunities.

Main price chart · unverifiedScalping · Day Trading
Explore
1.7Klikes48.8Kviews14comments
Save

Likes, views, and comments are historical TradingView snapshots. They describe attention, not trading performance.

START WITH A QUESTION

A little less searching.
A lot more understanding.

Tell DeepAlpha what you need. Get an explanation, a shortlist,
and a direct path to the indicators behind it.

Ask DeepAlpha