YOUR INDICATOR RESEARCH STARTS HERE

Find the right indicator.
Understand what it does.

Explore 11,183 indicators. Filter beyond the obvious.
Discover the tools that fit the way you trade.

THE INDICATOR LIBRARY

Results for “TRAP”

11,183 tools to explore

41 indicators matching your filters
Save search
TrendMomentumEditor’s pick

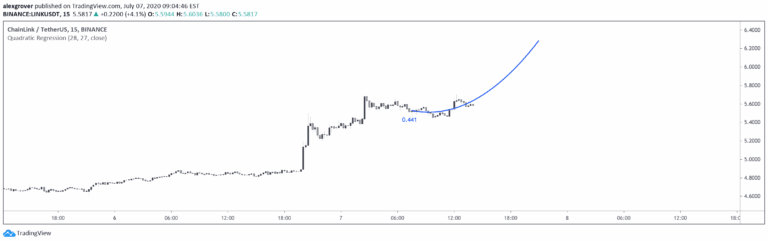
Quadratic Regression

by alexgrover

A quadratic regression indicator that fits a parabolic curve to price data, allowing traders to analyze non-linear trends and potentially forecast future price movements.

Main price chart · unverifiedDay Trading · Swing Trading
Explore
2.5Klikes45.8Kviews81comments
Save
TrendMomentum

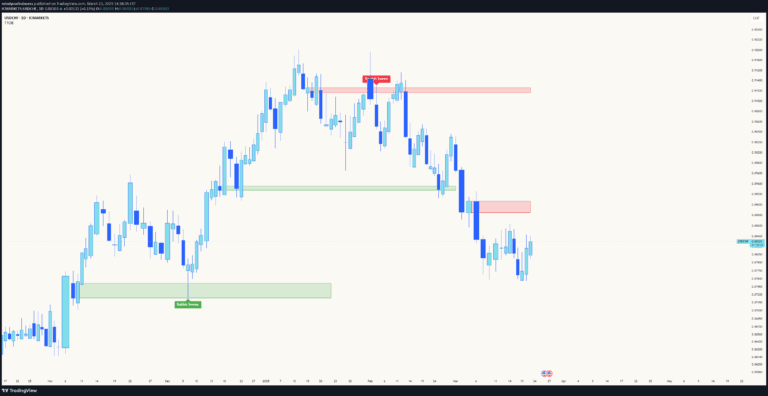
Trapped Traders Order Blocks

by mindyourbuisness

The Trapped Traders Order Blocks indicator identifies potential market reversals by detecting scenarios where large traders are caught in losing positions, signaling possible trend changes.

Main price chart · unverifiedSwing Trading
Explore
1.5Klikes22.6Kviews14comments
Save
TrendSignalLevels

Birdies [LuxAlgo]

by LuxAlgo

A unique indicator using swing points to project bird-like patterns that reveal potential support/resistance zones and trend direction through visual breakout signals.

Main price chart · unverifiedDay Trading · Swing Trading
Explore
1Klikes17.1Kviews0comments
Save
LevelsSignalVolatility

Range Deviations @joshuuu

by joshuuu

A market range indicator that identifies trading session boundaries and potential daily high/low points using predefined and custom time ranges for traders.

Main price chart · unverifiedScalping · Day Trading
Explore
918likes13.9Kviews9comments
Save
MomentumOscillatorSignal

Apex Edge – Super RSI

by ApexEdge

An advanced RSI signal engine that provides institutional-grade trading insights with divergence detection, trap identification, and multi-timeframe confluence for precise market entry points.

Separate pane · unverifiedScalping · Day Trading
Explore
357likes6Kviews7comments
Save
LevelsSignal

Trap Trading - SwaG

by swagato25

An intraday trading strategy focusing on identifying and trading false breakouts around key price levels using 5-minute timeframe charts.

Main price chart · unverifiedScalping · Day Trading
Explore
330likes13.9Kviews13comments
Save

Likes, views, and comments are historical TradingView snapshots. They describe attention, not trading performance.

START WITH A QUESTION

A little less searching.
A lot more understanding.

Tell DeepAlpha what you need. Get an explanation, a shortlist,
and a direct path to the indicators behind it.

Ask DeepAlpha