Chart VWAP
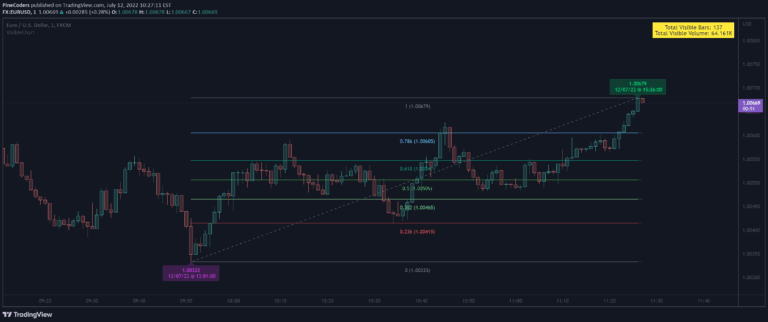
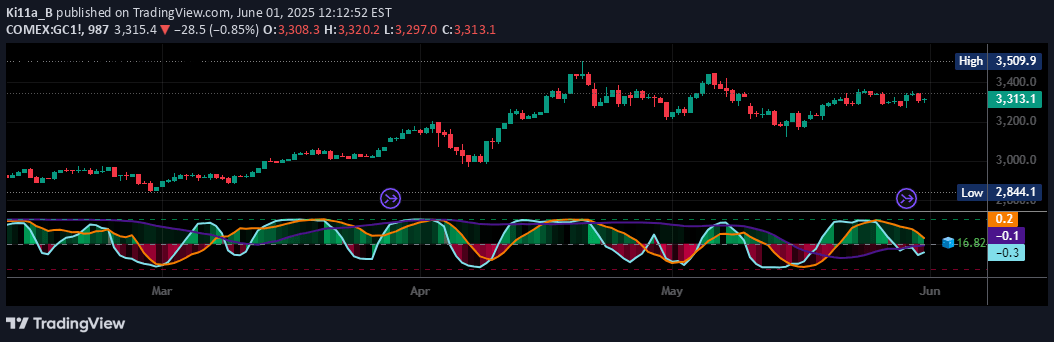
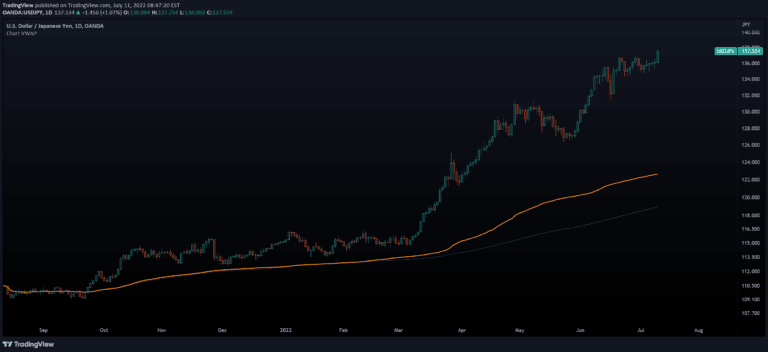
A dynamic Volume-Weighted Average Price (VWAP) indicator that calculates on visible chart bars, offering traders a flexible way to analyze price movement and volume across different chart views.
Explore 11,183 indicators. Filter beyond the obvious.
Discover the tools that fit the way you trade.
11,183 tools to explore
A dynamic Volume-Weighted Average Price (VWAP) indicator that calculates on visible chart bars, offering traders a flexible way to analyze price movement and volume across different chart views.
A Pine Script library providing dynamic functions to analyze chart bars, allowing traders to extract key insights like high, low, volume, and price information based on visible chart range.
A flexible tool that generates visible-range profiles for almost any TradingView indicator, allowing traders to visualize and analyze indicator values dynamically.
A dynamic Fibonacci extension tool that automatically calculates and plots support and resistance levels on a chart, helping traders identify potential price targets and reversal zones.
A multi-timeframe indicator that decomposes candles into lower timeframes, providing detailed insights into price action, support, and resistance levels in real-time.
A flexible AVWAP indicator that automatically calculates volume-weighted average prices across multiple timeframes, providing strategic market insights and custom anchoring options.
A trading indicator that draws horizontal lines spaced 10% apart to help traders visualize price volatility and track market momentum through volume display.
An auto-magnifier tool that zooms into main timeframe candles, revealing lower timeframe price action and volume details with customizable visualization.
A chart measurement tool that helps traders quickly understand the current chart's price range and time frame, providing instant context for potential trading decisions.
BK AK-Scope is an advanced trading intelligence system that analyzes market momentum using a Triple-Tier TSI Correlation Engine with adaptive volatility scoring and real-time signal clarity.
A TradingView script that identifies the largest price range from previous 15-minute candles, drawing horizontal lines to highlight key support and resistance levels for traders.
An advanced indicator for displaying Daily, Weekly, Monthly, and Yearly opening price levels across multiple chart types, providing critical support and resistance reference points for traders.
Likes, views, and comments are historical TradingView snapshots. They describe attention, not trading performance.