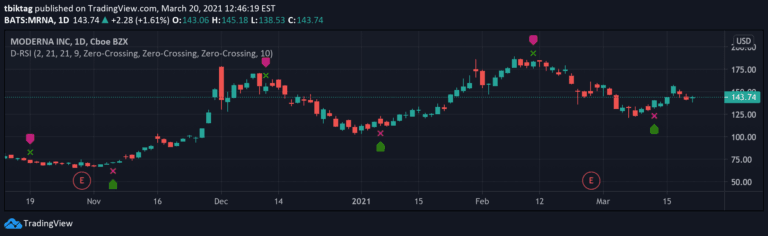
Delta-RSI Oscillator Strategy
Delta-RSI Oscillator is a momentum indicator that measures the rate of change in RSI through a smoothed time derivative, providing dynamic insights into market momentum shifts.
Explore 11,183 indicators. Filter beyond the obvious.
Discover the tools that fit the way you trade.
11,183 tools to explore
Delta-RSI Oscillator is a momentum indicator that measures the rate of change in RSI through a smoothed time derivative, providing dynamic insights into market momentum shifts.
A momentum-based trading signal that measures price changes over time, using speed and acceleration principles to identify potential trend directions and trading setups.
A comprehensive volume analysis tool that examines trading volume dynamics, measuring market participation, interest, and potential price movement signals through multiple volume-based indicators.
Parabolic RSI combines Parabolic SAR with Relative Strength Index to identify momentum shifts and potential trend reversals using a unique diamond-based signal system.
A specialized indicator that identifies liquidity grab zones in price action, highlighting potential market reversal or acceleration areas through custom pivot and wick analysis.
Kalman PSaR combines Parabolic SAR with Kalman Filter to create a dynamic trend-following indicator that reduces noise and improves signal accuracy for traders.
An adaptive exponential trend system that plots a dynamic trend line with volatility-adjusted extensions, providing early trend identification and momentum visualization.
Dynamic grid trading indicator that uses parabolic curves to create adaptive support and resistance levels across different market conditions and trends.
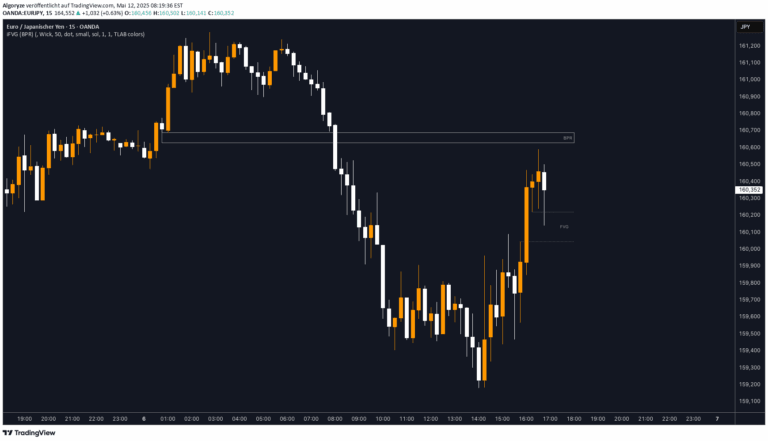
An advanced trading indicator that identifies Fair Value Gaps (FVGs) and Inversion Zones, helping traders spot market imbalances and potential high-reaction points.
A technique analyzing Donchian Channel percent widths to identify cyclical new price peaks, providing insights into market dynamics and potential trend shifts.
Colorful Moving Averages is an advanced indicator that visualizes price momentum through color-coded moving averages, revealing trend direction, momentum, and acceleration in a single view.
A momentum indicator that analyzes price velocity and acceleration using mathematical calculations, providing insights into market momentum through color-coded visual representations.
Likes, views, and comments are historical TradingView snapshots. They describe attention, not trading performance.