M2 Global Liquidity Index
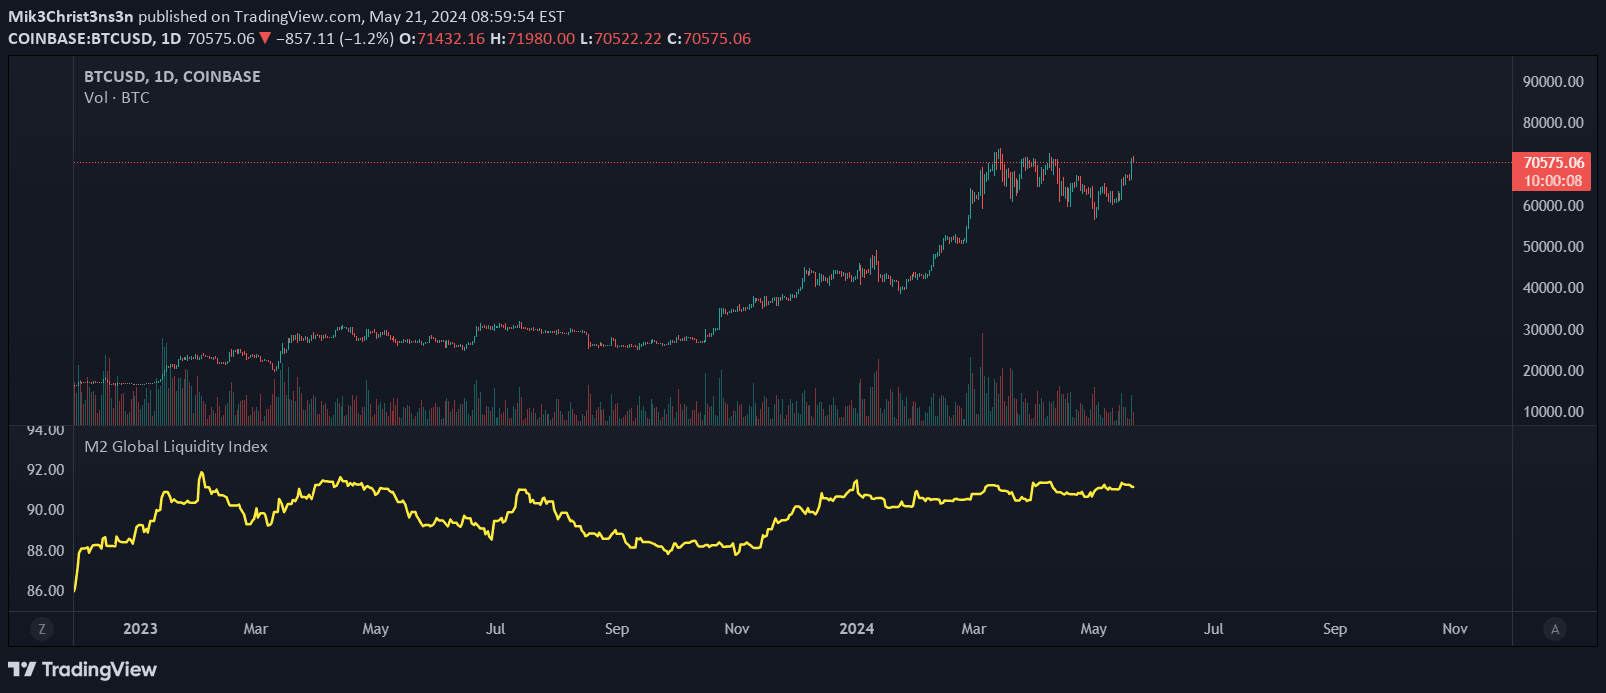
The M2 Global Liquidity Index tracks aggregate money supply across five major currencies, providing a comprehensive view of global economic liquidity and potential market trends.
Explore 11,183 indicators. Filter beyond the obvious.
Discover the tools that fit the way you trade.
11,183 tools to explore
The M2 Global Liquidity Index tracks aggregate money supply across five major currencies, providing a comprehensive view of global economic liquidity and potential market trends.
A dynamic asset rotation system analyzing six assets using multiple trend indicators to identify and hold the most optimal performing asset against USD and across asset pairs.
A Keltner Channel strategy incorporating Kelly ratio for dynamic position sizing, with optional take-profit and stop-loss parameters to enhance trading performance and risk management.
A polar chart tool that visualizes cryptocurrency dominance by combining traded dollar volume and volatility across multiple timeframes for easy comparative analysis.
The Stablecoin Supply Ratio Oscillator analyzes market sentiment by comparing Bitcoin's market cap to stablecoin market caps, using z-score transformation to identify potential market turning points.
A comprehensive trading script enabling portfolio management and performance analysis with customizable settings for instrument selection, capital allocation, and benchmark comparison.
A comprehensive money management tool for crypto traders that calculates position sizes, risk, and take-profit targets with precision and discipline.
Position Cost Distribution estimates share allocation across price levels by tracking daily trade volume and inferring share transfers between price ranges.
Bitcoin Thermocap analyzes market dynamics by evaluating Bitcoin's value relative to cumulative historical block mining, offering multiple interpretation modes for long-term investment insights.
A multi-asset histogram indicator that calculates performance scores for up to 10 different assets, providing a comprehensive visual comparison of their relative trends and strengths.
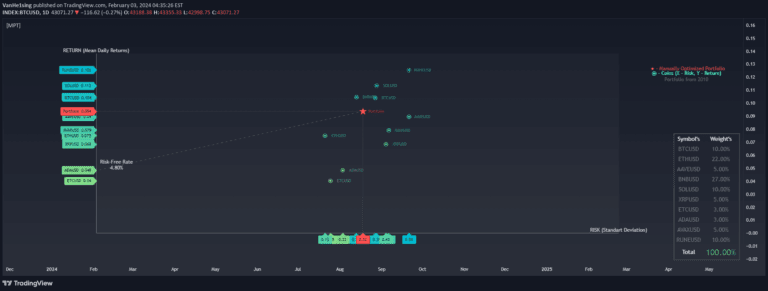
A Modern Portfolio Theory tool that helps traders optimize investment allocations by analyzing risk and return across multiple assets using a comprehensive scatter plot visualization.
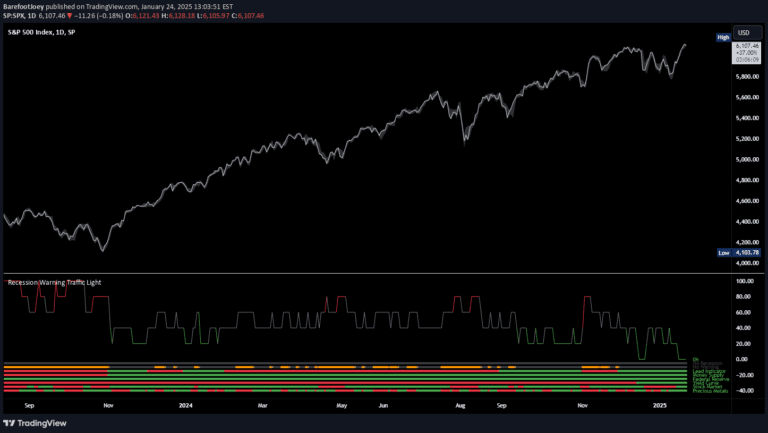
A multi-metric recession probability indicator using six key economic factors to assess potential economic downturns by analyzing various financial and market signals.
Likes, views, and comments are historical TradingView snapshots. They describe attention, not trading performance.