Trend Channels With Liquidity Breaks [ChartPrime]
A trend channel indicator that identifies support and resistance zones using pivot highs and lows, helping traders visualize market trends and potential breakout points.
Explore 11,183 indicators. Filter beyond the obvious.
Discover the tools that fit the way you trade.
11,183 tools to explore
A trend channel indicator that identifies support and resistance zones using pivot highs and lows, helping traders visualize market trends and potential breakout points.
A dynamic trading panel displaying multiple technical indicators in a color-coded table format, allowing traders to quickly assess market conditions across multiple symbols simultaneously.
A higher timeframe indicator that identifies and visualizes fair value gaps in price movement, highlighting potential trading opportunities through color-coded background and candle representations.
A comprehensive financial indicator that displays up to 9 fundamental metrics from income statements, balance sheets, cash flow, and financial statistics directly on your trading chart.
A dynamic trend-following oscillator based on CCI that tracks market trends, identifies potential reversals, and provides visual trend confirmation through adaptive trailing stops and color-coded alerts.
A comprehensive trading system using machine-engineered signals combining RSI, SuperTrend, and adaptive candle coloring for precise market entry and trend detection.
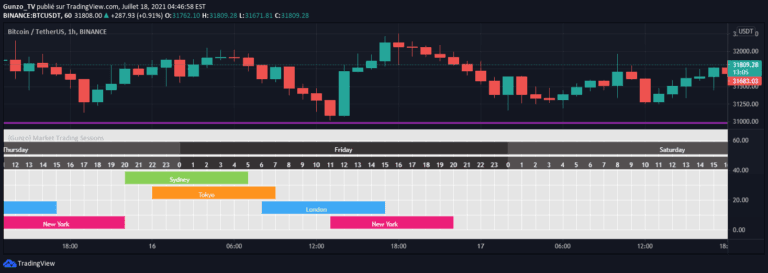
Market Trading Sessions tool helps traders identify optimal trading times by visualizing non-overlapping global market sessions across different time zones and regions.
A relative strength indicator comparing a stock's performance to an index by measuring the distance from moving averages, providing insights into comparative market behavior.
A multi-dimensional trading signal that identifies potential trend reversals and continuations using engulfing candle patterns, band lines, and color-coded visual indicators.
A volume-based trading indicator that identifies potential market trend reversals by analyzing Price Volume Trend (PVT) swing points across customizable lookback periods.
Volume X-ray is a specialized tool that compares intraday and end-of-day volume data, helping traders understand volume reporting discrepancies across different financial instruments.
The Mean Deviation Index (MDX) measures price deviation from a mean using standard deviation of ATR, visually indicating when price moves beyond a specified threshold.
Likes, views, and comments are historical TradingView snapshots. They describe attention, not trading performance.