3Commas Bot
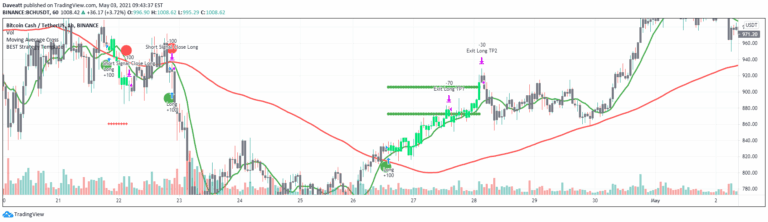
A 3Commas TradingView bot strategy offering automated trading with risk management, using moving average crossovers and customizable stop-loss and limit order settings.
Explore 11,183 indicators. Filter beyond the obvious.
Discover the tools that fit the way you trade.
11,183 tools to explore
A 3Commas TradingView bot strategy offering automated trading with risk management, using moving average crossovers and customizable stop-loss and limit order settings.
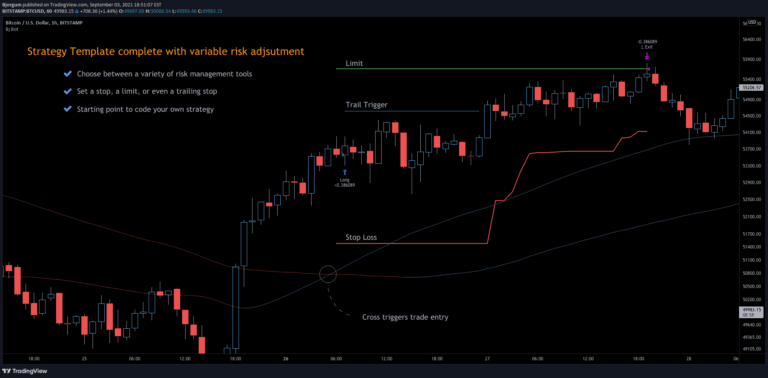
A universal strategy template for TradingView that allows traders to convert any indicator into a tradable strategy with comprehensive risk management and backtesting features.
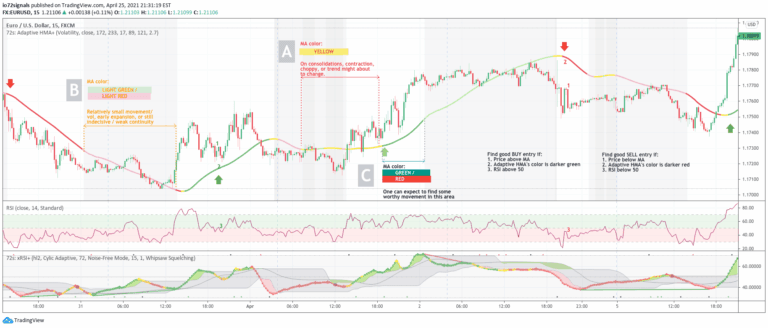
An adaptive Hull Moving Average that dynamically adjusts its period based on volume and volatility, providing clearer trend signals and market condition insights for traders.
A trading signal that identifies support and resistance levels using zigzag patterns, divergence detection, and oscillator analysis to highlight potential trend reversals and market momentum shifts.
A live footprint indicator showing bid/ask volume and delta at price levels, providing real-time trading volume insights with two distinct visualization modes.
A trading indicator that defines specific market sessions and visualizes price ranges through defining ranges (DR) and implied defining ranges (IDR) with color-coded graphical elements.
A dynamic trend analysis tool that filters market noise and uses color-gradient visualization to help traders identify trend strength, momentum shifts, and potential reversals.
A Fibonacci-based indicator that detects pivot points, support, and resistance levels by analyzing price action pin lengths and helping traders identify potential trading zones.
A dynamic indicator that analyzes price positioning against levels, providing probability-based insights into market momentum and strength through color-coded visualizations.
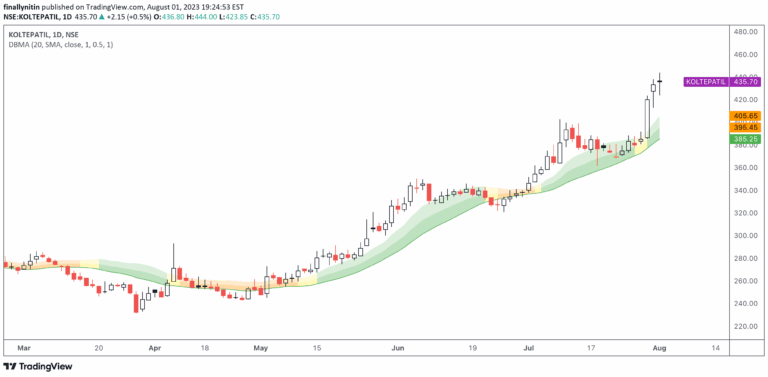
A Dual Bollinger Moving Average (DBMA) indicator that uses moving averages and Bollinger Bands to analyze price compression and potential trading opportunities.
RSI Order Blocks is a trading indicator that identifies potential support and resistance zones using the Relative Strength Index, helping traders visualize key price areas with customizable detection parameters.
Range Tightening Indicator tracks price volatility, identifying low-volatility consolidation periods that potentially signal upcoming market breakouts and momentum shifts.
Likes, views, and comments are historical TradingView snapshots. They describe attention, not trading performance.