OTT Collection
OTT is a versatile trend-following indicator that tracks price movements using a sophisticated mathematical construct, offering multiple adaptable systems for trend detection and signal generation.
Explore 11,183 indicators. Filter beyond the obvious.
Discover the tools that fit the way you trade.
11,183 tools to explore
OTT is a versatile trend-following indicator that tracks price movements using a sophisticated mathematical construct, offering multiple adaptable systems for trend detection and signal generation.
A volume analysis tool comparing tick and lower time frame data to measure price and volume movements, revealing volume delta and cumulative volume delta in trading.
A dynamic trading indicator tracking previous and current day high/low levels with customizable visualization to help traders identify key support and resistance zones throughout the trading session.
An indicator that draws higher timeframe OHLC data, demonstrating a structured coding approach with types and methods in TradingView.
A technical analysis indicator that combines market slope and RSI to detect potential price reversals by analyzing the slope's momentum and identifying early trend change signals.
A comprehensive collection of 140 unique Moving Average types designed to provide traders with diverse analytical tools for tracking market trends and price movements.
A dynamic support and resistance line tracking mechanism using maps to monitor price crossovers, automatically adjusting line properties and removing lines after maximum crosses.
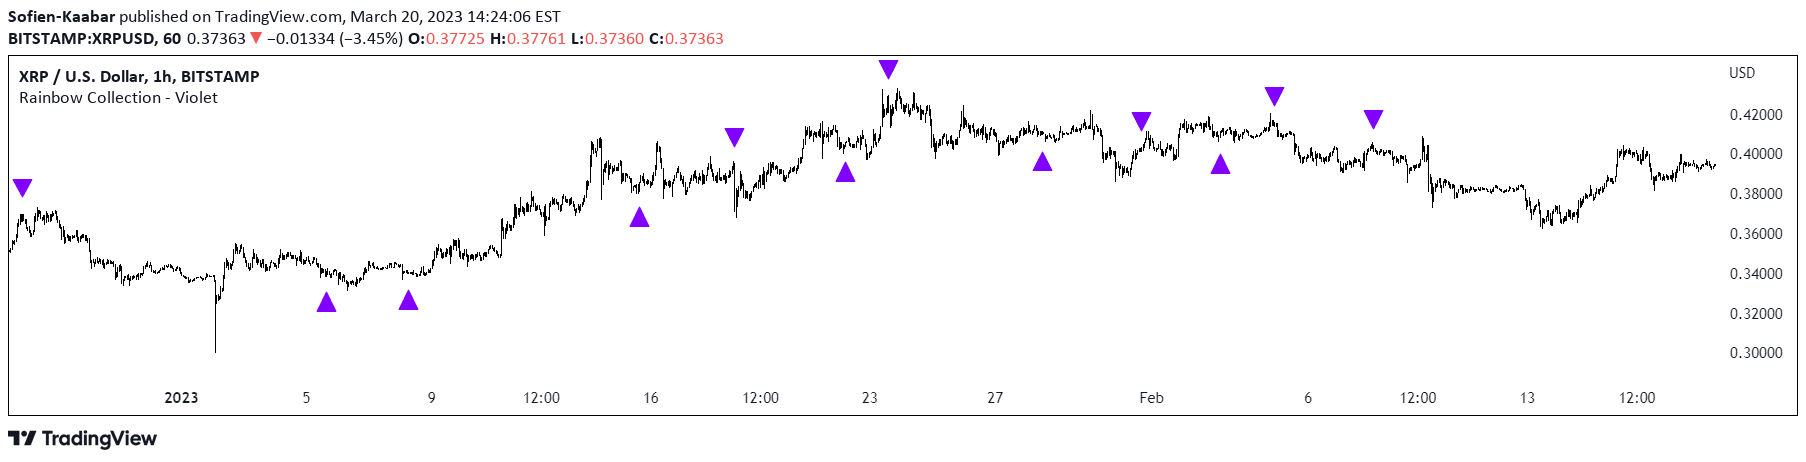
The Violet indicator uses a 20-period Hull moving average to identify potential market trend reversals by analyzing multiple historical price periods relative to their moving averages.
A customizable chart indicator that marks significant historical events across various market domains, helping traders understand contextual market behavior and potential trend influences.
A liquidity indicator identifying potential price zones with low resistance by tracking consecutive lower swing highs without bearish fair value gaps in a downtrend.
A TradingView indicator that analyzes Renko chart timestamp duplications to assess the reliability and precision of automated trading strategies.
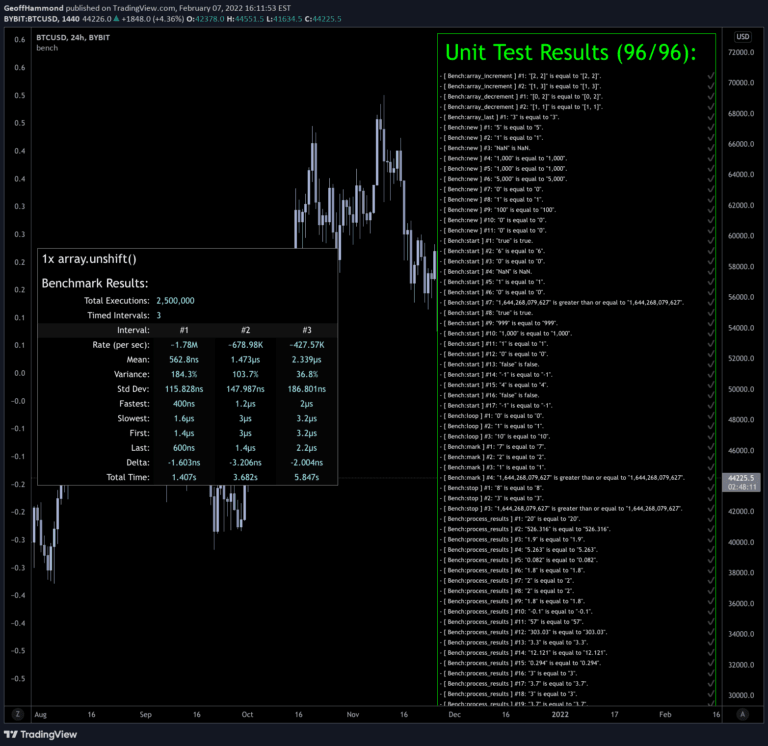
A Pine Script library designed to analyze script performance and identify bottlenecks through comprehensive benchmarking techniques for complex trading algorithms.
Likes, views, and comments are historical TradingView snapshots. They describe attention, not trading performance.