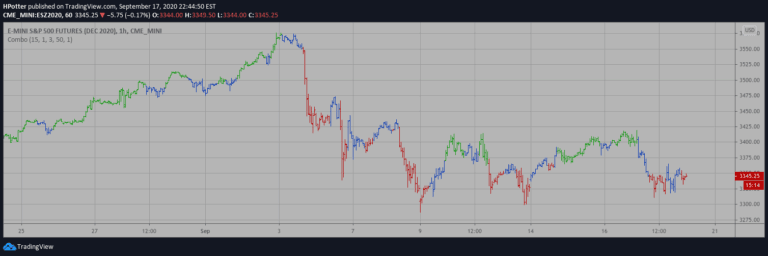
Auto Fibonacci and Gann Fan/Retracements Combo
A comprehensive technical analysis tool combining Fibonacci and Gann fan/retracements to identify potential support, resistance, and price movement levels across multiple chart perspectives.
Explore 11,183 indicators. Filter beyond the obvious.
Discover the tools that fit the way you trade.
11,183 tools to explore
A comprehensive technical analysis tool combining Fibonacci and Gann fan/retracements to identify potential support, resistance, and price movement levels across multiple chart perspectives.
The Strat indicator provides a comprehensive trading toolkit for identifying candle numbers, pivot machine guns, custom combos, and generating various trading statistics.
A combo trading strategy combining price action and stochastic oscillator signals to identify market trends and potential entry/exit points using two distinct analytical approaches.
A multi-indicator trading strategy combining RSI, MFI, and WPR to detect market momentum, identify potential entry and exit points, and provide comprehensive trading signals.
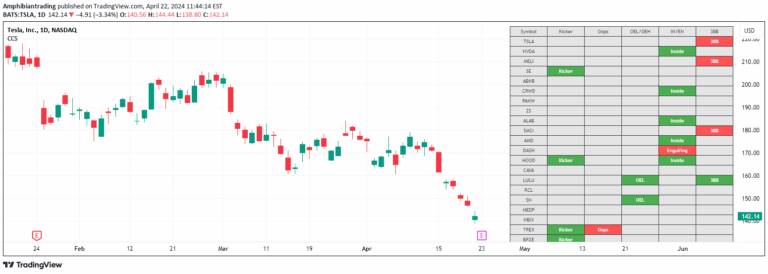
A screening tool that identifies specific candlestick combinations across multiple tickers, highlighting unique price action patterns and potential trend reversals.
A multi-indicator strategy combining RSI, StochRSI, and MFI to analyze market momentum, identify overbought/oversold conditions, and confirm potential trend reversals.
A composite technical indicator combining Commodity Channel Index (CCI) and Relative Strength Index (RSI) to generate trading signals through dynamic momentum analysis and visual chart overlays.
A trading strategy that identifies specific candlestick formations across multiple timeframes to help traders recognize potential price action setups and market dynamics.
A market analysis tool measuring option seller hedging requirements and potential price movement dynamics using Gamma Exposure (GEX) and multiple moving averages for trend identification.
A 1-3-1 pattern detection strategy focusing on candle behavior and identifying potential trading setups through specific bar configurations.
A unique candlestick pattern detector that identifies potential trend reversals by analyzing specific sequential candle formations, helping traders spot key market transition points.
A TradingView visual tool for manual trading analysis that allows configurable display of OrderBloque concept variables across different timeframes and trading functions.
Likes, views, and comments are historical TradingView snapshots. They describe attention, not trading performance.