Volume Analysis - Heatmap and Volume Profile
Advanced volume analysis tool that creates a heatmap and volume profile, providing detailed insights into trading volume, price movements, and market structure across different time frames.
Explore 11,183 indicators. Filter beyond the obvious.
Discover the tools that fit the way you trade.
11,183 tools to explore
Advanced volume analysis tool that creates a heatmap and volume profile, providing detailed insights into trading volume, price movements, and market structure across different time frames.
A unique Fibonacci indicator that plots golden zone levels as a wave, tracking the latest trend by analyzing highest and lowest points in recent price action.
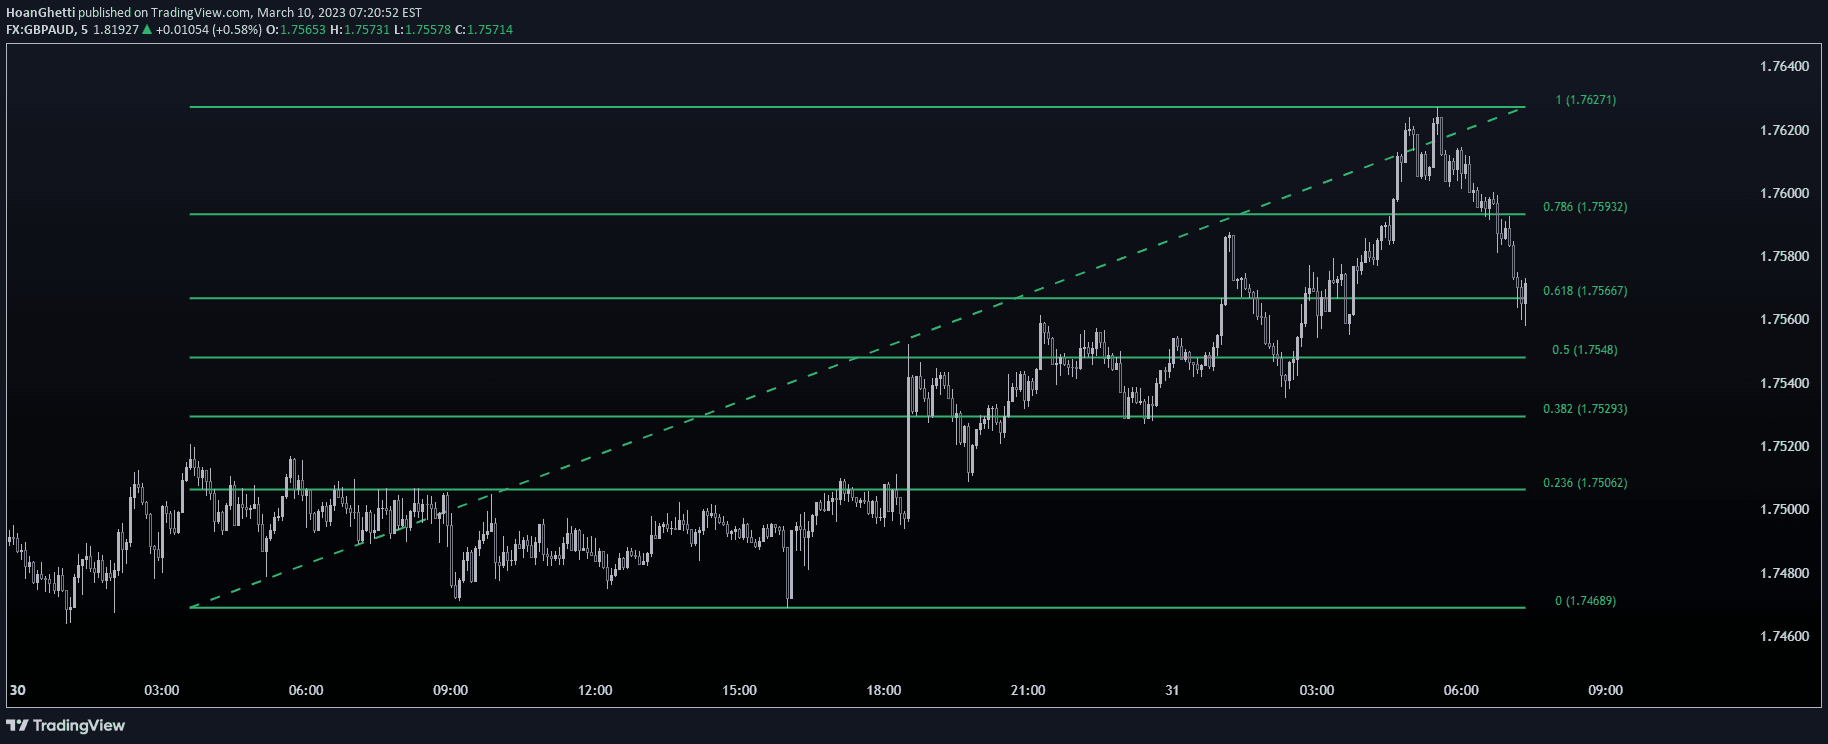
A dynamic Fibonacci retracement tool that automatically adjusts trendlines and levels based on current price movement, providing adaptive support and resistance analysis.
A sophisticated technical indicator combining Z-Score and Heikin Ashi to analyze price movements, providing standardized volatility insights and trend identification.
A nonparametric volatility oscillator that measures trend strength using Gini mean difference across multiple simple moving averages, providing objective structural trend analysis.
An indicator that tracks inside bars by remembering the range of the previous candle, highlighting bars that remain within that specific price range.
Rolling Volume Profile tracks volume distribution along price trajectories, dynamically updating to provide real-time insights into market trends and volume movement.
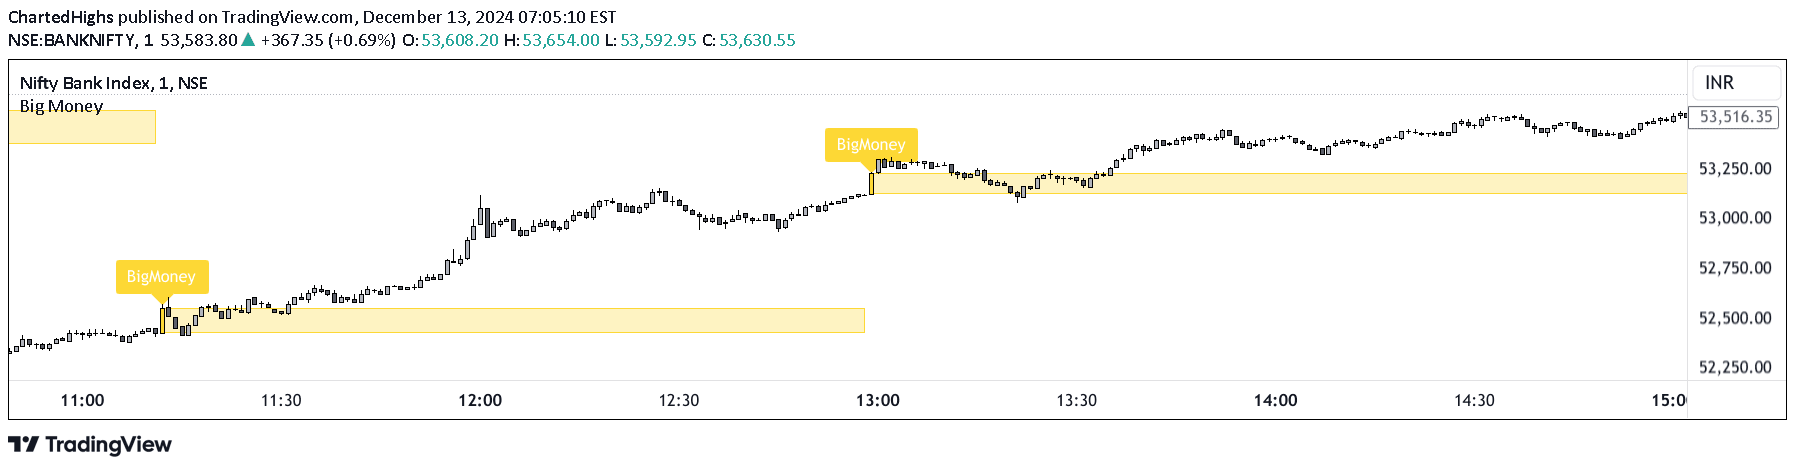
A trading indicator that highlights significant price movements by identifying candles with price changes exceeding a user-defined threshold, helping traders spot potential big-money market moments.
A dynamic ticker tape that displays real-time price updates and daily changes for multiple securities, scrolling horizontally across the chart bottom for instant market insights.
Multi VWAP tool creates automatic Anchored Volume Weighted Average Price lines for various timeframes, helping traders identify trend direction and institutional trading levels.
A MACD histogram area indicator that measures cumulative momentum by tracking regions above and below the zero line, providing insights into trend strength and potential reversals.
An advanced trading indicator that automatically detects and alerts multiple harmonic chart patterns, providing traders with comprehensive pattern recognition across different market conditions.
Likes, views, and comments are historical TradingView snapshots. They describe attention, not trading performance.