Rolling Point of Control (POC) [AlgoAlpha]
Dynamic Point of Control indicator that reveals market-dominant price levels using volume or price profiles, helping traders identify key support and resistance zones with customizable analysis.
Explore 11,183 indicators. Filter beyond the obvious.
Discover the tools that fit the way you trade.
11,183 tools to explore
Dynamic Point of Control indicator that reveals market-dominant price levels using volume or price profiles, helping traders identify key support and resistance zones with customizable analysis.
An advanced market structure indicator that detects swing highs and lows across multiple timeframes, providing robust insights into market dynamics and trend identification.
Bar Balance is an advanced trading indicator that analyzes intrabar composition, revealing the strength and balance of price movements by counting up, down, and neutral intrabars within each chart bar.
Theta Shield is an options trading indicator that uses stochastic oscillation to predict market sideways phases and help traders avoid potential theta decay in option positions.
An advanced support and resistance indicator that identifies key price zones using Average True Range and historical price action to assess trading boundaries and potential market reversals.
The Trend Counter analyzes market direction by counting price bars above and below average levels, providing visual insights into trend strength and potential reversals.
A color-coded indicator that tracks the number of price bars with higher closing prices, revealing historical price strength and potential trend dynamics.
A dynamic trend indicator that uses moving averages and streak analysis to identify market momentum, potential reversals, and provide visual trend insights across multiple price data points.
A multi-timeframe trend indicator using SMEMA that calculates market direction and strength across six timeframes, providing comprehensive trend analysis with adaptable weighting profiles.
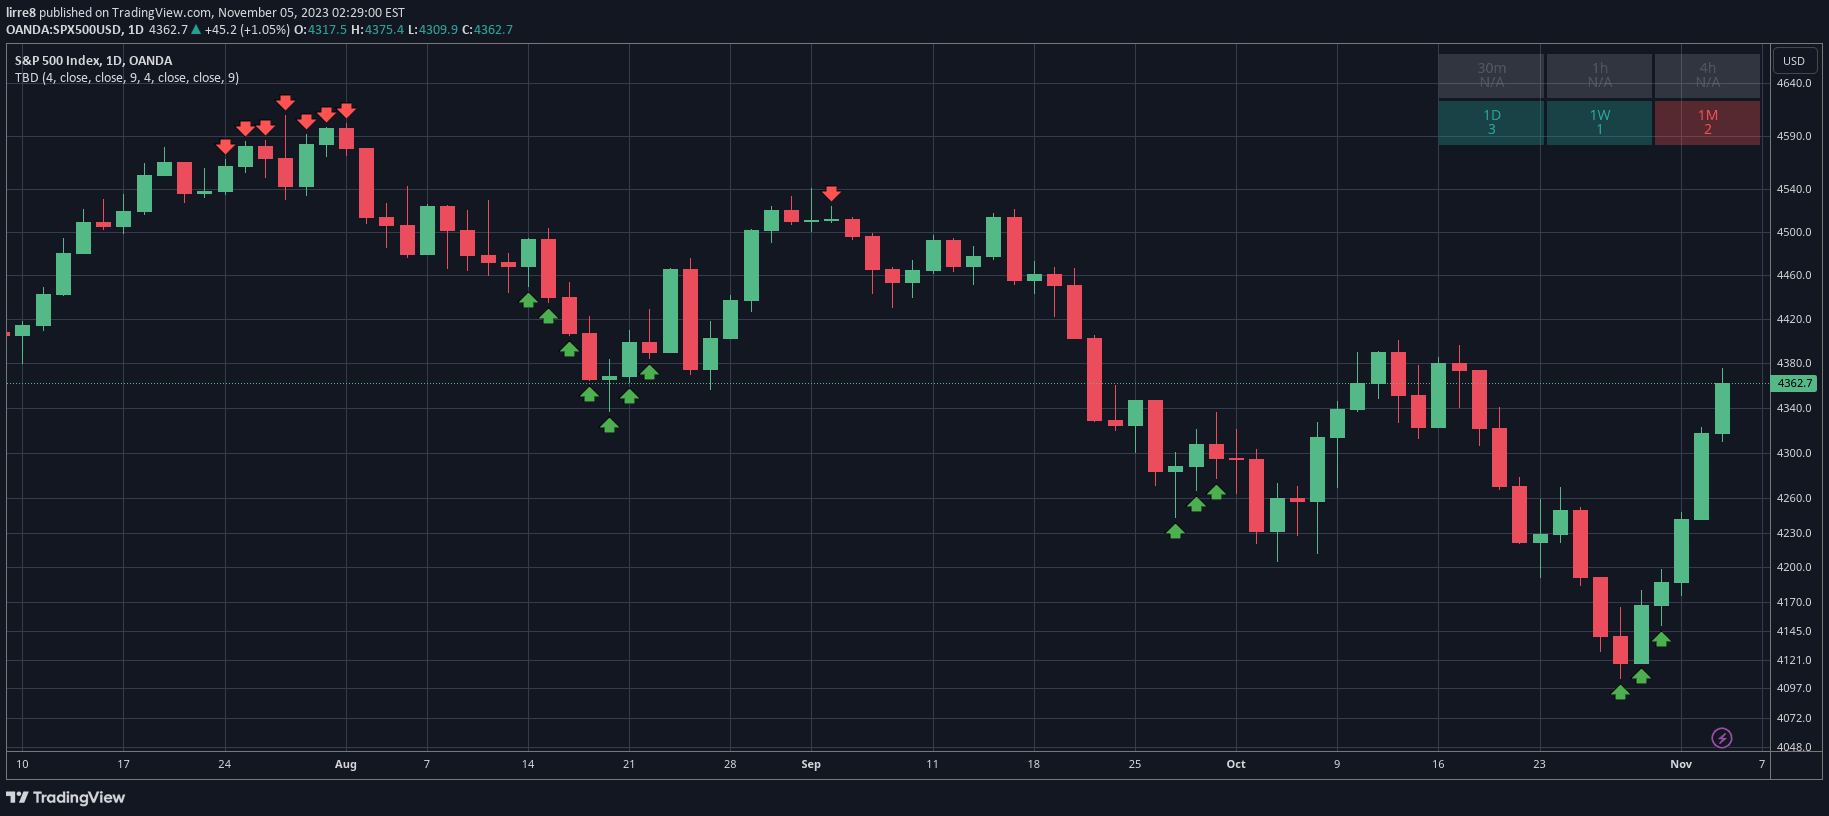
A trading indicator that detects potential market tops and bottoms by counting consecutive candles based on price comparison and predefined criteria across multiple timeframes.
A cutting system that analyzes momentum candle volumes to identify dynamic support and resistance levels by comparing green and red candle transaction volumes across multiple layers.
A tool that analyzes pinbar candles by counting the number of candles inside the wick and measuring the volume within the wick, providing insights into potential price movement.
Likes, views, and comments are historical TradingView snapshots. They describe attention, not trading performance.