Delta-RSI Oscillator Strategy
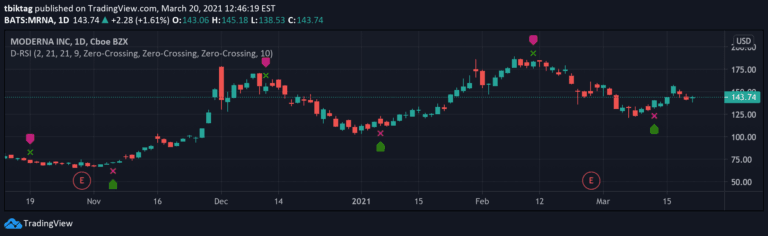
Delta-RSI Oscillator is a momentum indicator that measures the rate of change in RSI through a smoothed time derivative, providing dynamic insights into market momentum shifts.
Explore 11,183 indicators. Filter beyond the obvious.
Discover the tools that fit the way you trade.
11,183 tools to explore
Delta-RSI Oscillator is a momentum indicator that measures the rate of change in RSI through a smoothed time derivative, providing dynamic insights into market momentum shifts.
A generalized Gaussian filter that smooths price data with variable pole orders, reducing noise and high-frequency market movements using advanced signal processing techniques.
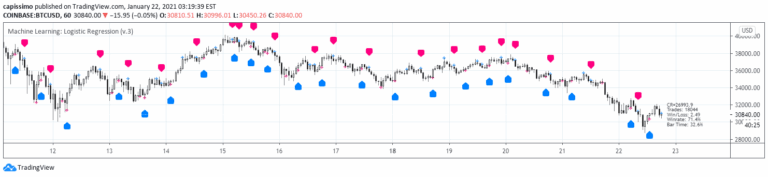
A machine learning strategy using logistic regression to classify market movements into binary categories by fitting a sigmoid curve to predict potential trading directions.
An advanced MACD variant that normalizes momentum measurements and uses Heikin-Ashi candles to provide smoother trend analysis across different assets and timeframes.
A meme-inspired trading indicator that identifies a McDonald's logo-shaped pattern using cubic Bezier curves, detecting specific market tops and bottoms with a unique visual representation.
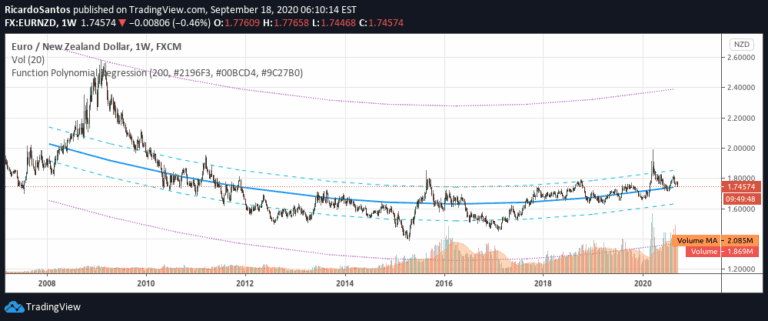
A polynomial regression function that analyzes data points to provide predictions, deviations, and statistical insights about trend and momentum patterns in financial datasets.
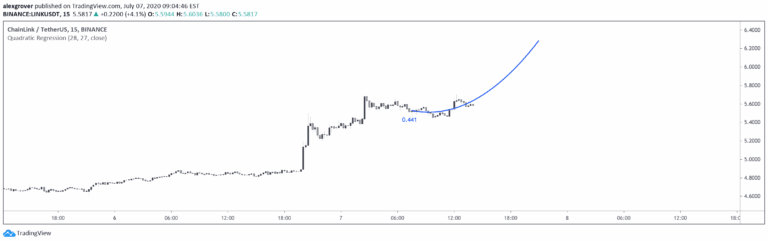
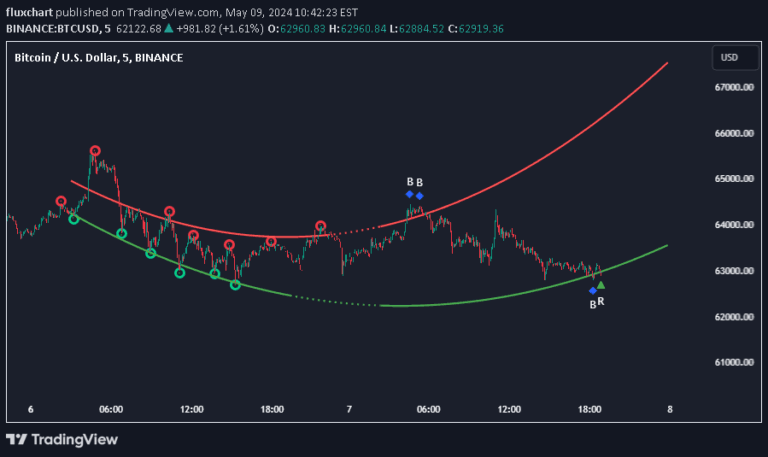
A quadratic regression indicator that fits a parabolic curve to price data, allowing traders to analyze non-linear trends and potentially forecast future price movements.
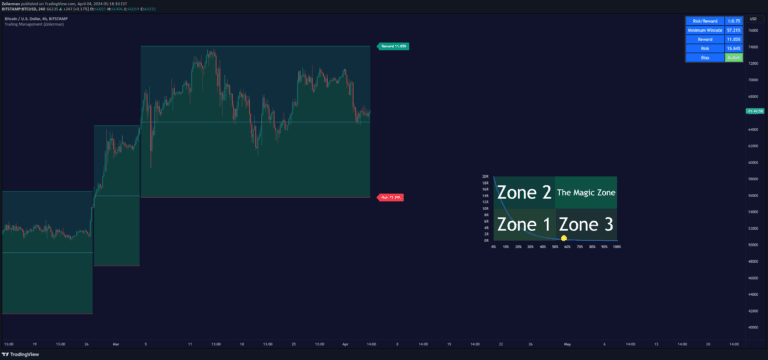
An advanced trading indicator that dynamically manages trailing stops, calculates break-even points, and helps traders optimize risk-reward strategies across different market conditions.
A dynamic asset rotation system analyzing six assets using multiple trend indicators to identify and hold the most optimal performing asset against USD and across asset pairs.
An innovative trading signal that fits an Archimedean spiral to price action, allowing traders to visualize price movement through a unique geometric representation with customizable parameters.
A polynomial regression indicator that calculates complex curve-fitting relationships between price variables, enabling advanced trend analysis and least squares moving average (LSMA) generation.
A dynamic support and resistance indicator using polynomial regression to identify price pivot points and potential trend reversal zones with customizable complexity.
Likes, views, and comments are historical TradingView snapshots. They describe attention, not trading performance.