Live Economic Calendar by toodegrees
Live Economic Calendar tracks global financial news events, providing real-time updates on market-moving events across multiple currencies with impact levels and detailed visualizations.
Explore 11,183 indicators. Filter beyond the obvious.
Discover the tools that fit the way you trade.
11,183 tools to explore
Live Economic Calendar tracks global financial news events, providing real-time updates on market-moving events across multiple currencies with impact levels and detailed visualizations.
ICT Algorithmic Macro Tracker plots key trading time windows based on Inner Circle Trader methodology, helping traders identify potential market movement periods across specific time intervals.
Predictive Channels is a real-time trend channel indicator that estimates supports, resistances, and an average line to help traders understand price movement and potential trend changes.
The Commitment of Traders (COT) report analyzes market positions of commercial, large, and small traders to provide strategic trading insights and market sentiment.
A machine learning regression tool using RANSAC to create robust trend analysis by filtering out market noise and identifying underlying price movements with greater accuracy.
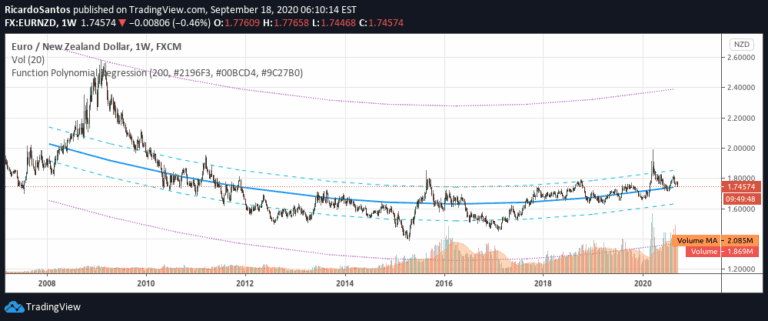
A polynomial regression function that analyzes data points to provide predictions, deviations, and statistical insights about trend and momentum patterns in financial datasets.
A trading tool that uses Interbank Price Delivery Algorithm to identify time windows and standard deviations across multiple timeframes for potential price movement prediction.
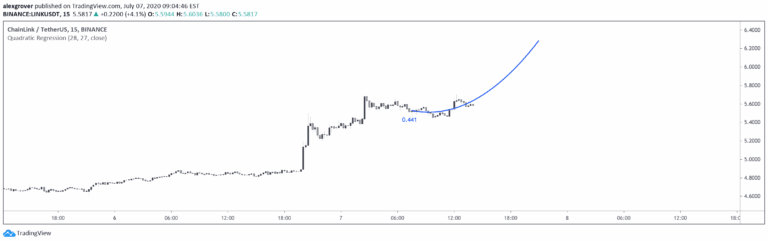
A quadratic regression indicator that fits a parabolic curve to price data, allowing traders to analyze non-linear trends and potentially forecast future price movements.
A custom Tradingview indicator designed to display chart information cleanly while providing a personalized watermark for traders seeking discipline and self-mastery.
An ICT trading technique focusing on liquidity draw potential for the next trading week by analyzing Friday's Asian Range on 5 and 15-minute charts.
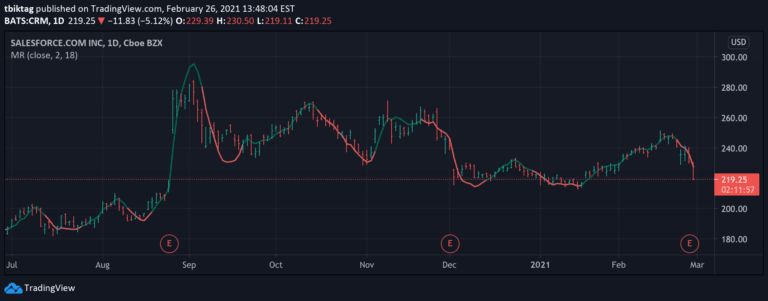
Moving Regression is a flexible trend analysis method that approximates data points using polynomial functions to smooth noise, assess momentum, and predict trend direction.
A machine learning trading indicator that generates adaptive buy and sell signals by analyzing historical price data and identifying complex market patterns using advanced algorithms.
Likes, views, and comments are historical TradingView snapshots. They describe attention, not trading performance.