YOUR INDICATOR RESEARCH STARTS HERE

Find the right indicator.
Understand what it does.

Explore 11,183 indicators. Filter beyond the obvious.
Discover the tools that fit the way you trade.

THE INDICATOR LIBRARY

Results for “downside”

11,183 tools to explore

34 indicators matching your filters
Save search
VolatilityEditor’s pick

Sharpe and Sortino Ratios

by TradingView

A comprehensive risk analysis tool that calculates Sharpe and Sortino ratios to evaluate investment performance relative to risk, helping traders assess the efficiency of their trading strategies.

Separate pane · unverifiedDay Trading · Swing Trading
Explore
654likes44.5Kviews4comments
Save
SignalVolatility

Implied Range from Options [SS]

by Steversteves

An options-based indicator that displays implied price ranges, providing context about potential market movements by analyzing options pricing and calculating expected range of price action.

Main price chart · unverifiedScalping · Day Trading
Explore
312likes8Kviews5comments
Save
MomentumSignalTrend

Expectation Breakers [QuantVue]

by QuantVue

An advanced trading signal that identifies market reversals by detecting price action that breaks typical expectations through downside and upside reversal patterns.

Main price chart · unverifiedScalping · Day Trading
Explore
240likes5Kviews3comments
Save
LevelsSignal

Key Levels Set

by ZeroHeroTrading

A trading tool that allows setting key support/resistance levels and detecting price breaks, with customizable alerts and visual tracking of market movements.

Main price chart · unverifiedScalping · Day Trading
Explore
143likes5.9Kviews2comments
Save
SignalTrendVolatility

Trailing stop

by mickes

A trailing stop alert script that helps traders manage long entry positions by tracking price movements using various methods like ATR, EMA, SMA, or external sources.

Main price chart · unverifiedScalping · Day Trading
Explore
140likes3.7Kviews3comments
Save
SignalTrend

Mxwll Hedge Suite [Mxwll]

by MXWLL-Capital-Trading

A trading tool that identifies the best negatively correlated asset for hedging by analyzing price correlations across different cryptocurrencies and determining precise hedge quantities.

Separate pane · unverifiedScalping · Day Trading
Explore
129likes5.1Kviews4comments
Save
MomentumSignalLevels

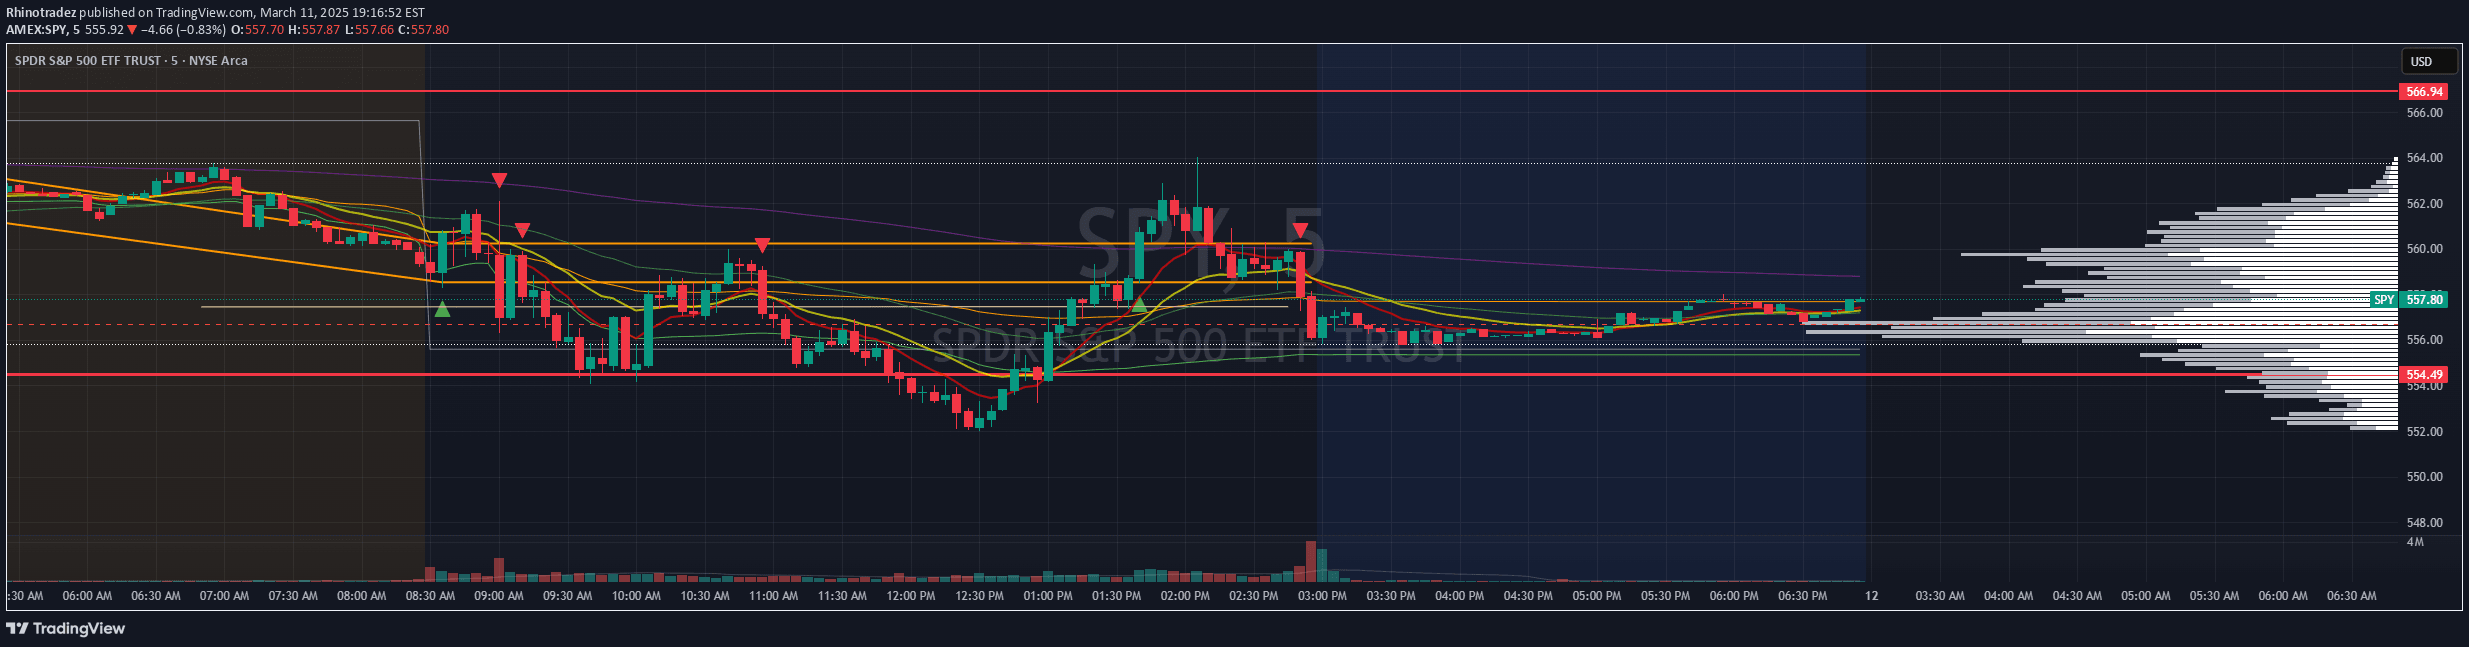
15-Minute ORB by @RhinoTradez

by Rhinotradez

15-Minute Opening Range Breakout (ORB) strategy tracks the first 15 minutes of market trading. Identifies potential breakout opportunities by marking high and low price levels for traders.

Main price chart · unverifiedScalping · Day Trading
Explore
110likes3Kviews2comments
Save
OscillatorSignalVolatility

Retail Pain Index (RPIx)

by DskyzInvestments

The Retail Pain Index is a behavioral volatility tool that measures market stress by tracking how far price moves from the average entry zone, revealing potential trading opportunities.

Separate pane · unverifiedScalping · Day Trading
Explore
82likes1.3Kviews4comments
Save

Likes, views, and comments are historical TradingView snapshots. They describe attention, not trading performance.

START WITH A QUESTION

A little less searching.
A lot more understanding.

Tell DeepAlpha what you need. Get an explanation, a shortlist,
and a direct path to the indicators behind it.

Ask DeepAlpha