2B Reversal Pattern (Expo)
The 2B reversal pattern identifies potential market trend reversals by detecting false breakouts and price rebounds, signaling opportune entry points for traders.
Explore 11,183 indicators. Filter beyond the obvious.
Discover the tools that fit the way you trade.
11,183 tools to explore
The 2B reversal pattern identifies potential market trend reversals by detecting false breakouts and price rebounds, signaling opportune entry points for traders.
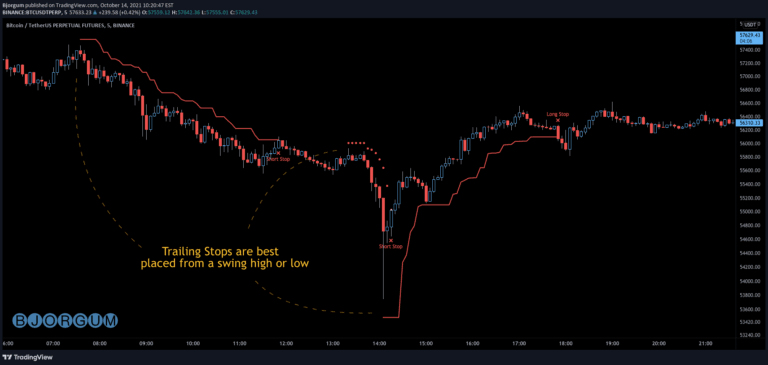
A versatile trailing stop management script for crypto and forex traders, offering multiple trail types to protect profits and manage risk dynamically during ongoing trades.
A tool that reveals seasonal price variations by calculating average price changes for specific days across multiple years, helping traders identify recurring market patterns.
A Pine Script watermark feature that allows dynamic annotation on trading charts, enabling personalized visual identification without violating platform rules.
Volume Spread Analysis indicator that detects market divergences and convergences by analyzing the relationship between price movements and trading volume.
StochRSI Zenith is a sophisticated technical indicator that combines Stochastic RSI with advanced visualization and multi-timeframe analysis for comprehensive market condition assessment.
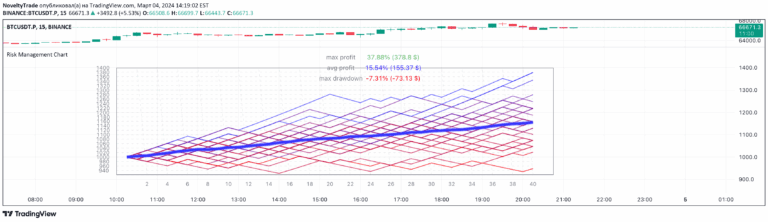
A trading tool that simulates random trades and visualizes risk management strategies by generating multiple trade scenarios with different win/loss probabilities and equity calculations.
Volume Spread Analysis indicator helps traders understand market intentions by analyzing volume and price movements through color-coded bars and predictive volume forecasting techniques.
A Pin Bar indicator that identifies four unique candlestick patterns to help traders recognize potential market reversals and trend continuations across different market conditions.
Tracks major central banks' balance sheets to analyze global liquidity levels and potential market impacts by monitoring asset size and monetary policy trends.
A customized RSI indicator with candlestick visualization, neon glow effect, overbought/oversold zones, and triple moving average buy/sell signals.
An adaptive Arnaud Legoux Moving Average (ALMA) that dynamically adjusts to market volatility, providing enhanced support and resistance signals with visual glow effects.
Likes, views, and comments are historical TradingView snapshots. They describe attention, not trading performance.