CM MACD Custom Indicator - Multiple Time Frame - V2
CM MACD Ultimate Multi-Timeframe V2 is an advanced MACD indicator with enhanced customization options, multi-timeframe analysis, and comprehensive trend visualization features.
Explore 11,183 indicators. Filter beyond the obvious.
Discover the tools that fit the way you trade.
11,183 tools to explore
CM MACD Ultimate Multi-Timeframe V2 is an advanced MACD indicator with enhanced customization options, multi-timeframe analysis, and comprehensive trend visualization features.
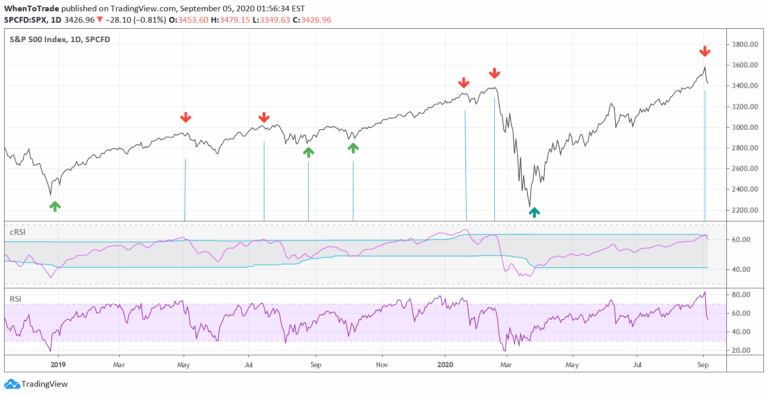
An enhanced RSI indicator that uses cyclic smoothing and adaptive bands to provide more responsive market trend signals by incorporating dominant cycle length.
A technical analysis indicator that identifies three-bar reversal patterns, helping traders detect potential trend changes by analyzing consecutive price bar formations and their relationships.
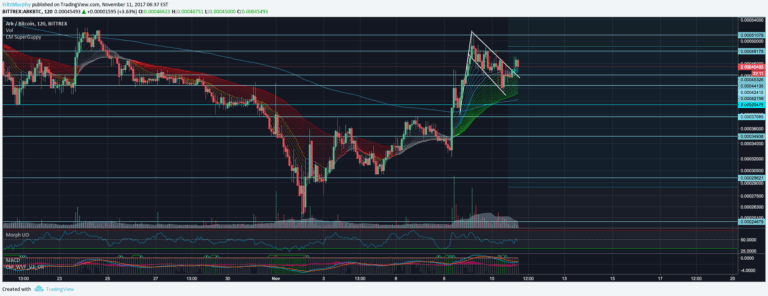
An enhanced Exponential Moving Average (EMA) script based on the Super Guppy format, designed to provide advanced trend analysis by utilizing multiple EMA lengths for comprehensive market insights.
A sophisticated technical analysis tool combining LOWESS smoothing and adaptive Gaussian moving average to detect trends, pivot points, and breakouts with enhanced market dynamics visualization.
A unique trading indicator combining Murrey Math formulas with Fibonacci retracement levels to identify potential market tops, bottoms, and long-term trend dynamics with enhanced precision.
An advanced trend channel indicator using pivot points and ATR to estimate trend direction quickly, with integrated candlestick pattern recognition for enhanced trading insights.
A multi-timeframe indicator that plots higher timeframe levels, detects breakouts, and visualizes trend direction to help traders identify key support and resistance zones.
A machine learning-enhanced momentum oscillator that analyzes market trends using weighted moving averages and k-Nearest Neighbors algorithm for dynamic and adaptive momentum prediction.
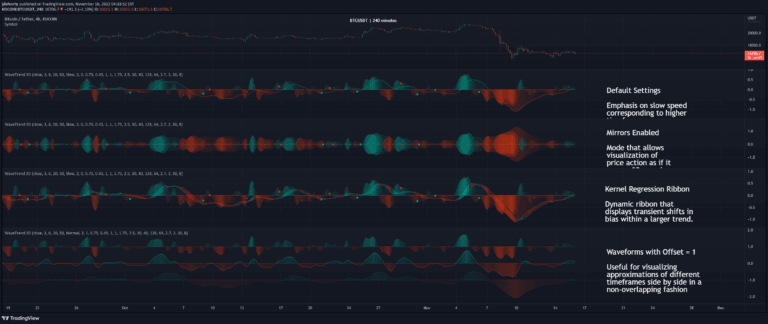
WaveTrend 3D is an advanced oscillator that uses digital signal processing and machine learning techniques to analyze price trends with enhanced precision and multi-timeframe support.
A trading indicator that highlights previous market highs and lows, creating customizable support and resistance zones across multiple timeframes to help traders identify potential price reaction levels.
Advanced machine learning trading tool using kernel regression to predict price targets and trends. Provides dynamic analysis with customizable settings for enhanced trading decision-making.
Likes, views, and comments are historical TradingView snapshots. They describe attention, not trading performance.