Bollinger Bands (Nadaraya Smoothed) | Flux Charts
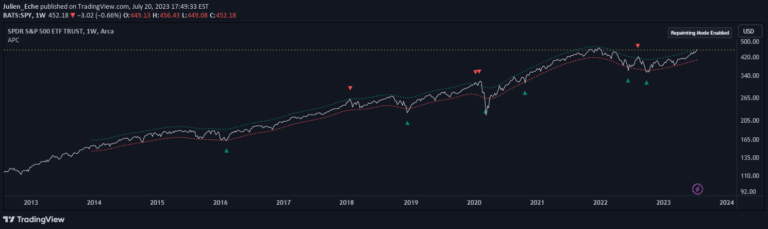
A Bollinger Bands upgrade using Nadaraya-Watson estimator to reduce noise and provide smoother price movement analysis with weighted kernel smoothing.
Explore 11,183 indicators. Filter beyond the obvious.
Discover the tools that fit the way you trade.
11,183 tools to explore
A Bollinger Bands upgrade using Nadaraya-Watson estimator to reduce noise and provide smoother price movement analysis with weighted kernel smoothing.
A sophisticated statistical approach using weighted Harrell-Davis quantile estimators to analyze price distributions more accurately than traditional methods, providing robust insights into market behavior.
An advanced volatility indicator that uses Z-Score standardization and Yang-Zhang volatility estimation to provide dynamic market volatility insights across different trading conditions.
An adaptive trading indicator using logarithmic price scaling and Nadaraya-Watson estimation to create dynamic price channels that adjust to market conditions and provide potential trading signals.
A comprehensive suite of volatility estimators that analyze market price fluctuations using multiple advanced mathematical approaches to quantify market uncertainty and potential price movements.
A sophisticated supertrend indicator combining advanced technical probability modeling with ATR price targets to provide dynamic trend and sentiment analysis for traders.
A specialized filtering method that provides responsive market variable averages with reduced time delay by leveraging historical data and time-of-day patterns for more timely analysis.
A sophisticated risk scoring system that calculates position size by evaluating stock performance, volatility, trader metrics, and drawdown tolerance for more precise trading risk management.
A probability-based momentum indicator that analyzes multiple technical indicators to predict market sentiment and potential price targets by comparing current conditions with historical performance.
A robust volatility estimator that integrates intra-candle and inter-candle price dynamics, measuring market fluctuations using open, high, low, and close prices with advanced statistical weighting.
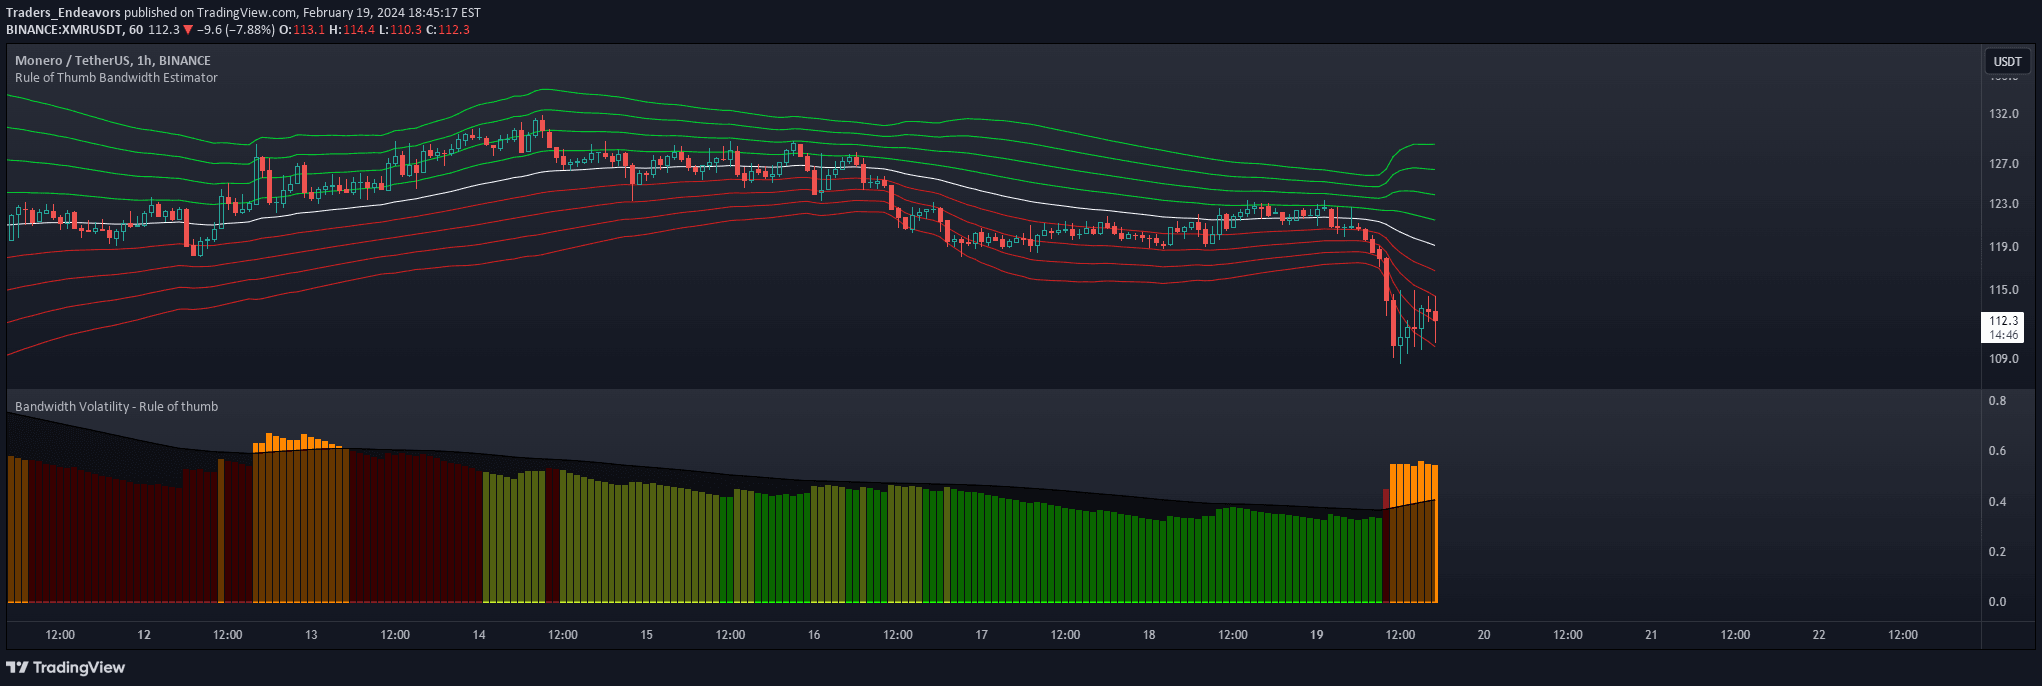
A volatility indicator using rule of thumb bandwidth estimator to measure market fluctuations by analyzing returns and standard deviations with color-coded visualization.
True Envelopes is an advanced price envelope indicator that dynamically tracks price movements using high-pass filtering and kernel density estimation to identify precise support and resistance levels.
Likes, views, and comments are historical TradingView snapshots. They describe attention, not trading performance.