YOUR INDICATOR RESEARCH STARTS HERE

Find the right indicator.
Understand what it does.

Explore 11,183 indicators. Filter beyond the obvious.
Discover the tools that fit the way you trade.

THE INDICATOR LIBRARY

Results for “event”

11,183 tools to explore

79 indicators matching your filters
Save search
TrendMomentumEditor’s pick

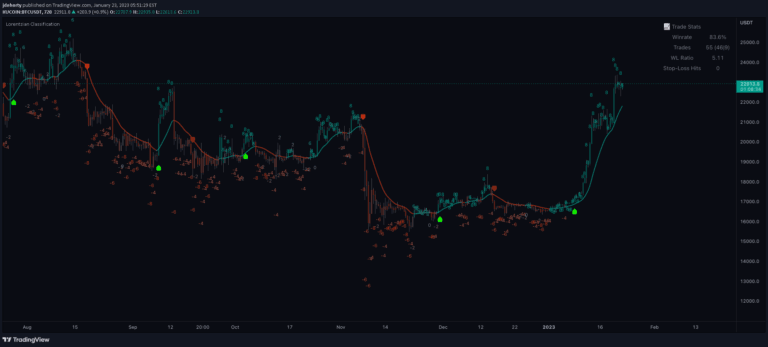
Machine Learning: Lorentzian Classification

by jdehorty

A machine learning trading signal using Lorentzian Distance Classifier to predict price movements by analyzing historical data patterns and identifying nearest neighbors in a multi-dimensional feature space.

Main price chartDay Trading · Swing Trading
Explore
24Klikes857.3Kviews784comments

Save
SignalVolatilityEditor’s pick

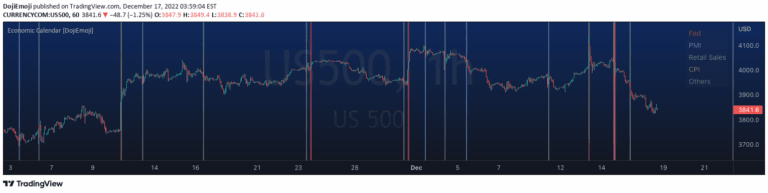
Live Economic Calendar by toodegrees

by toodegrees

Live Economic Calendar tracks global financial news events, providing real-time updates on market-moving events across multiple currencies with impact levels and detailed visualizations.

Main price chart · unverifiedDay Trading · Swing Trading
Explore
7Klikes131.6Kviews152comments
Save
SignalLevels

ICT NWOG/NDOG & EHPDA [LuxAlgo]

by LuxAlgo

A trading indicator identifying weekly and daily opening gaps alongside Event Horizon Price Discovery Arrays, designed to highlight potential support and resistance zones.

Main price chart · unverifiedScalping · Day Trading
Explore
2.7Klikes88.9Kviews32comments
Save
PatternsSignalTrend

Faytterro Market Structere

by faytterro

A market structure indicator that tracks price zigzags, identifying trend changes and market structure breaks with color-coded visualization and adjustable parameters.

Main price chart · unverifiedScalping · Day Trading
Explore
825likes22.2Kviews29comments
Save
SignalLevels

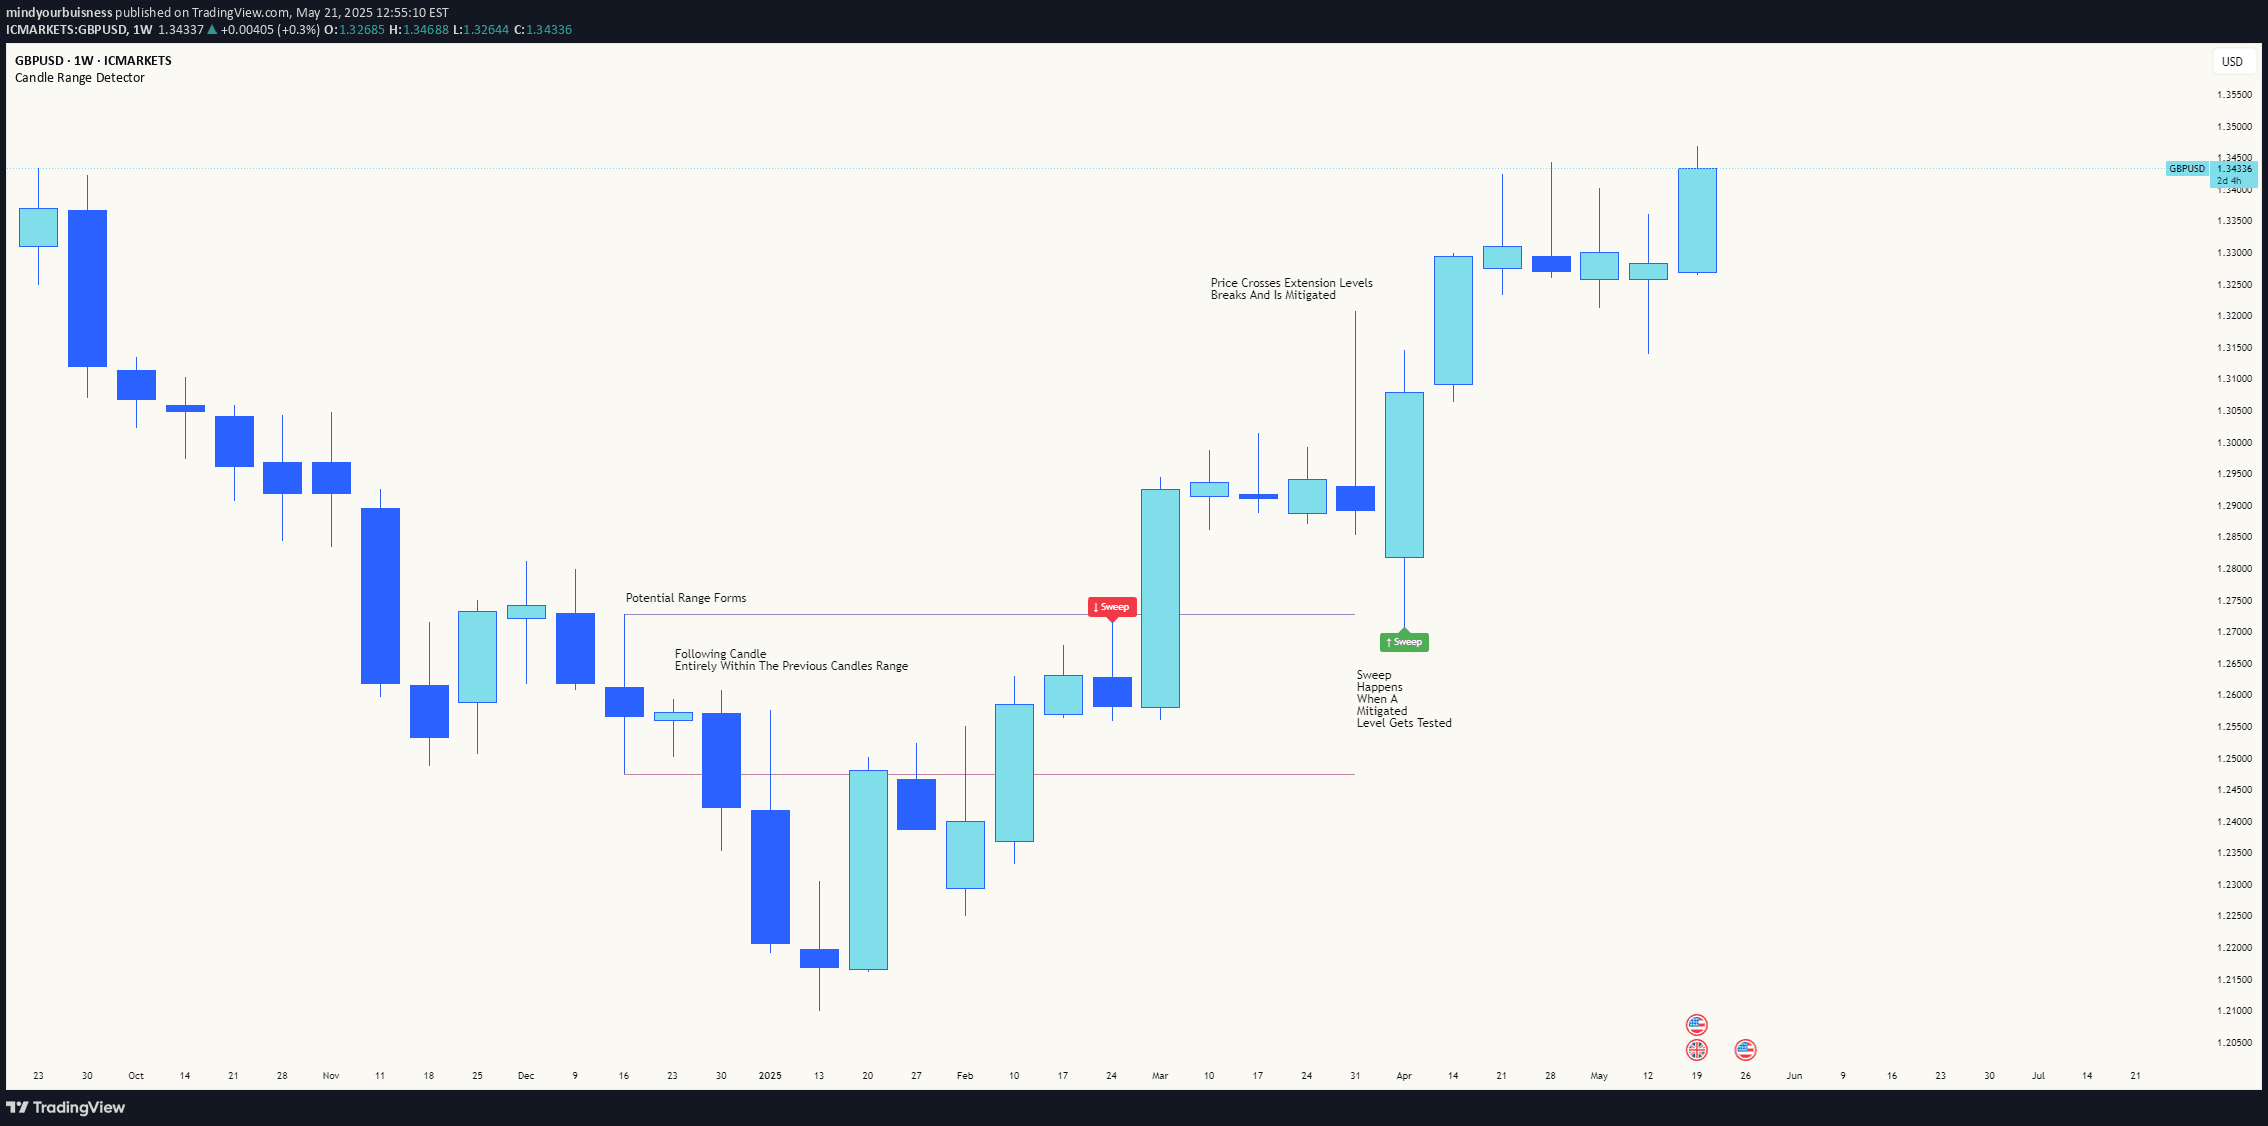
Candle Range Detector

by mindyourbuisness

An advanced trading indicator that detects price ranges, tracks range mitigation, and identifies sweep events to highlight potential liquidity zones and market movement signals.

Main price chart · unverifiedScalping · Day Trading
Explore
804likes11.7Kviews1comments
Save
MomentumVolatilityEditor’s pick

RSI Impact Heat Map [Trendoscope]

by Trendoscope

A dynamic RSI event tracking tool that measures market impact through heat maps, analyzing price displacement after specific RSI crossover or crossunder events.

Separate pane · unverifiedDay Trading · Swing Trading
Explore
554likes51.7Kviews23comments
Save
SignalLevels

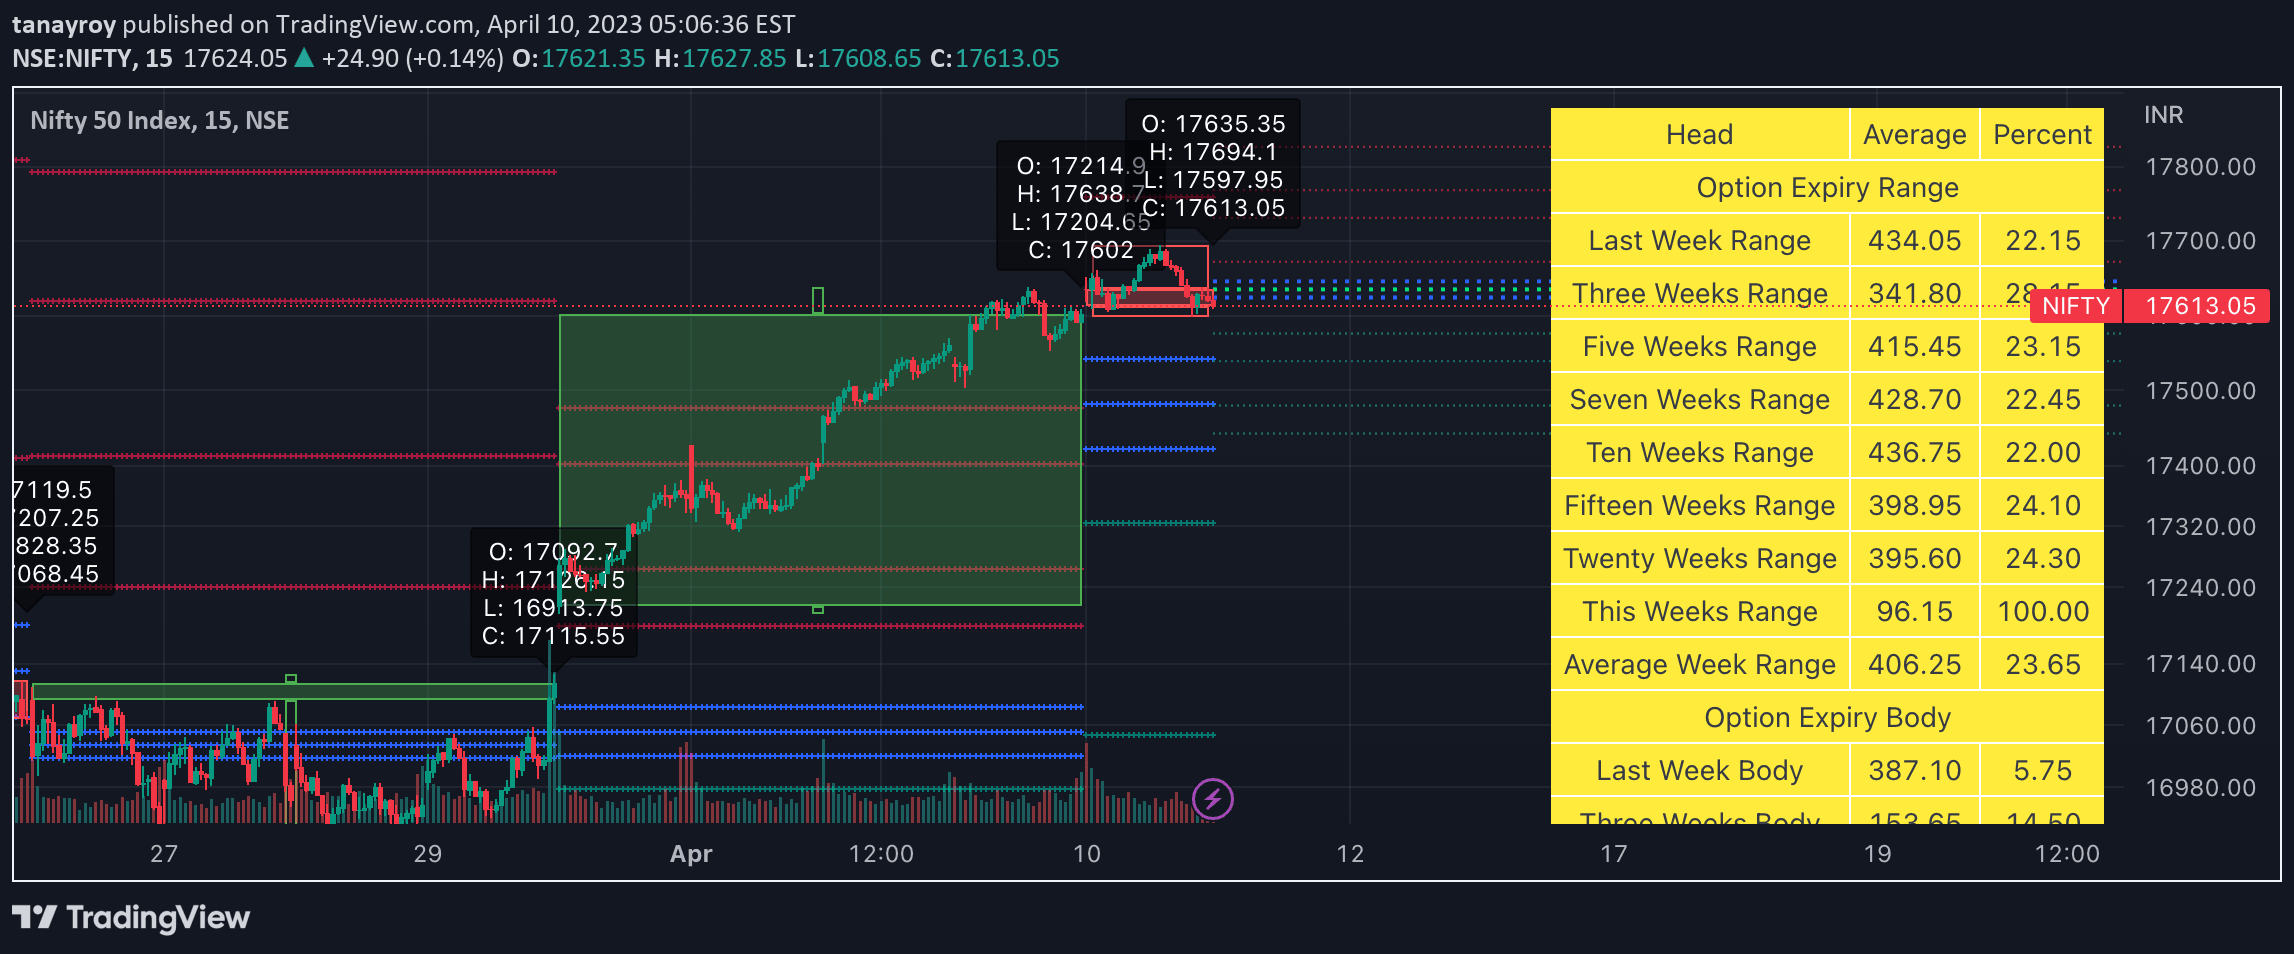
Weekly Options Expiry Candle V.2

by tanayroy

A trading tool that tracks weekly options expiry candles in India, providing visual insights into market movements, pivot points, and expiry-related statistical data for intraday trading.

Main price chart · unverifiedScalping · Day Trading
Explore
536likes15.9Kviews18comments
Save
VolumeEditor’s pick

Earnings, Splits, Dividends

by MichelT

A Pine Script method for retrieving financial event data like earnings reports, stock splits, and dividend information using TradingView's inner data representation system.

Main price chart · unverifiedDay Trading · Swing Trading
Explore
416likes14.9Kviews19comments
Save

Likes, views, and comments are historical TradingView snapshots. They describe attention, not trading performance.

START WITH A QUESTION

A little less searching.
A lot more understanding.

Tell DeepAlpha what you need. Get an explanation, a shortlist,
and a direct path to the indicators behind it.

Ask DeepAlpha