Revolution Volatility Bands With Range Contraction Signal VII
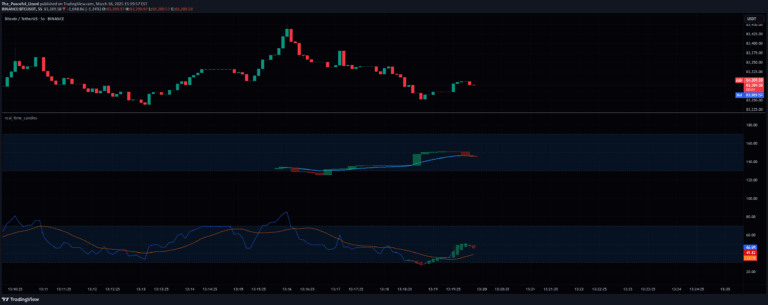
A volatility-based indicator that identifies price contraction periods by analyzing band narrowing and price behavior, signaling potential upcoming market movements.
Explore 11,183 indicators. Filter beyond the obvious.
Discover the tools that fit the way you trade.
11,183 tools to explore
A volatility-based indicator that identifies price contraction periods by analyzing band narrowing and price behavior, signaling potential upcoming market movements.
Advanced volume mapping tool revealing institutional trading activity, volume distribution, and fair value drift across price ranges with dynamic zone analysis.
A tool tracking the supply dominance of major stablecoins, showing their relative market share and evolution over time across different cryptocurrency markets.
An advanced trading indicator using triple moving averages, linear regression, and RSI to identify market trends, trade potential, and provide comprehensive trade management tools.
A planetary aspect oscillator that tracks the angular relationships between planets, offering unique insights into potential market influences through astrological energy measurements.
A widget tracking yield curve dynamics, allowing traders to compare current and historical yield curves and detect potential market inversions with a simple visual interface.
A fractal indicator identifying high and low points on a chart by comparing surrounding candles, with options for confirmation and alert functionality.
A sophisticated Pine Script library that enables real-time candle generation across multiple timeframes, allowing traders to visualize price action and indicators dynamically within current bars.
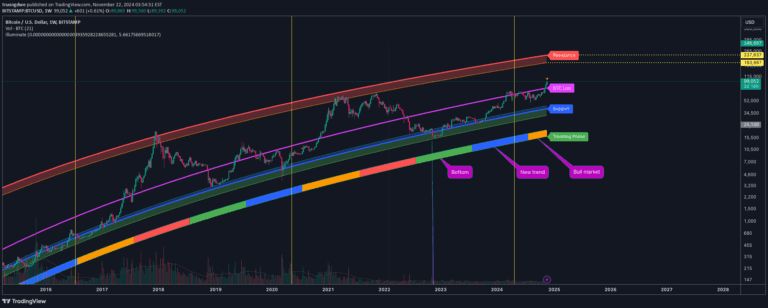
A Bitcoin price prediction script using logarithmic regression that analyzes historical trends, halvings, and potential price ranges to provide strategic insights into long-term Bitcoin market movements.
A Bitcoin price oscillator that normalizes long-term logarithmic growth, providing a structured view of price movements within fixed boundaries for trend analysis.
Lyapunov Market Instability uses chaos theory to analyze market dynamics, revealing whether markets are trending or ranging by measuring trajectory divergence and regime changes.
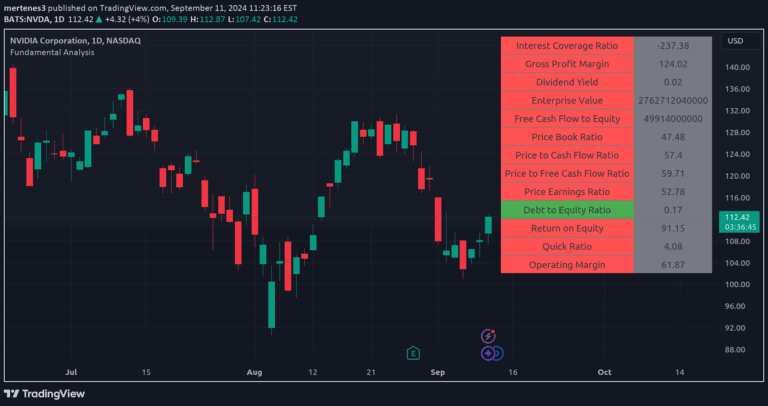
A comprehensive financial metrics indicator that provides quick, color-coded insights into a company's financial health through multiple essential ratios and performance indicators.
Likes, views, and comments are historical TradingView snapshots. They describe attention, not trading performance.