ICT Power Of Three | Flux Charts
An advanced trading indicator using ICT's Power Of Three strategy to detect smart money movements through accumulation, manipulation, and distribution phases.
Explore 11,183 indicators. Filter beyond the obvious.
Discover the tools that fit the way you trade.
11,183 tools to explore
An advanced trading indicator using ICT's Power Of Three strategy to detect smart money movements through accumulation, manipulation, and distribution phases.
A predictive indicator that estimates maximum and minimum price levels within a specified trading session, providing support/resistance insights and hit rate probabilities for traders.
An options dashboard displaying real-time call and put strike prices across 16 strikes, helping traders analyze market sentiment and potential trend direction through options data visualization.
Analyst Table provides comprehensive visual representation of analyst estimates and recommendations, displaying price targets and sentiment directly on the trading chart for quick market insights.
Z-scored VIX indicator measures market volatility expectations using standard deviation from the mean, providing insights into potential S&P 500 trend reversals.
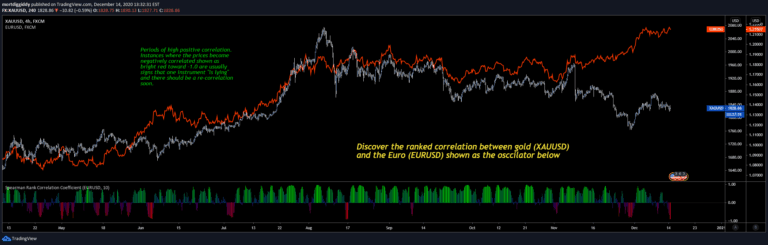
Spearman rank correlation coefficient measures the relationship between two variables by analyzing how they increase or decrease together, revealing potential market synchronization patterns.
A trading signal analyzing stock price behaviors after significant price movements, helping traders understand potential patterns and expectations during volatile market conditions.
A trading tool that plots expected price move boxes using implied volatility from options, helping traders visualize potential price ranges for weekly, monthly, and yearly timeframes.
An options-based indicator that displays implied price ranges, providing context about potential market movements by analyzing options pricing and calculating expected range of price action.
The Intrabar Run Count Indicator analyzes price data's randomness using statistical runs test, helping traders identify potential market inefficiencies within individual price bars.
A volatility indicator comparing implied and historical market volatility, helping traders understand market expectations and actual price movements through two distinct volatility measures.
A trading indicator that analyzes the Euclidean Distance of previous 5 candles to predict potential price movements, ranges, and sentiment across different timeframes.
Likes, views, and comments are historical TradingView snapshots. They describe attention, not trading performance.