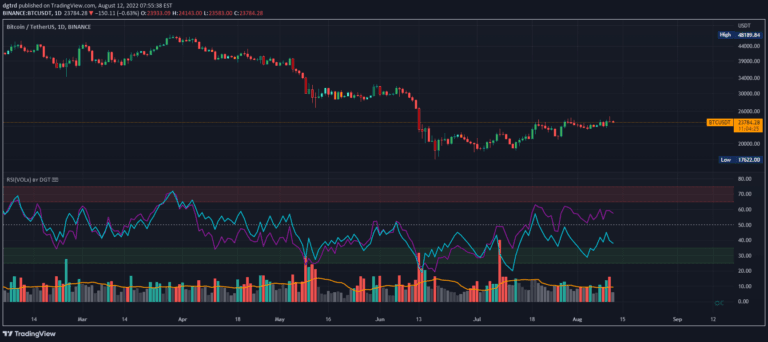
Relative Strength of Volume Indicators by DGT
RSI is a momentum oscillator measuring price movement speed, analyzing price changes and volume to identify potential trend reversals and market conditions.
Explore 11,183 indicators. Filter beyond the obvious.
Discover the tools that fit the way you trade.
11,183 tools to explore
RSI is a momentum oscillator measuring price movement speed, analyzing price changes and volume to identify potential trend reversals and market conditions.
Average Force is an oscillating indicator that calculates market sentiment by measuring price dynamics and trend strength through smoothed calculations of market movement.
A simple RSI-based trading script that identifies bullish and bearish market periods by comparing color-coded RSI lines, providing visual insights into market momentum and potential trend changes.
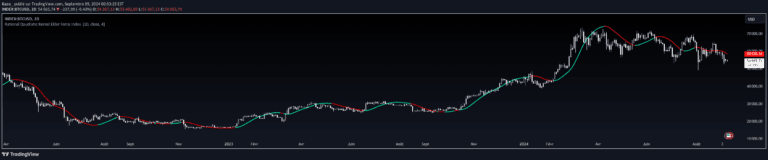
An advanced Elder Force Index using rational quadratic kernel smoothing to measure price movement strength by combining price change and volume with enhanced analytical precision.
A volume-based indicator that measures price movement intensity and potential market pressure by combining price changes with trading volume to identify trend strength and potential reversals.
An advanced indicator that uses moving average derivatives to predict price movement through acceleration and slope analysis, creating predictive parabolic models for future price trends.
A hybrid indicator combining Double Exponential Moving Average with Elder Force Index to analyze price trends and volume strength, providing comprehensive market movement insights.
A composite momentum indicator combining four key market analysis techniques to measure price movement, volume, and market sentiment in a single normalized score.
A custom Vortex Indicator that measures trend strength by comparing upward and downward movement lines, helping traders identify momentum shifts and potential entry points.
A configurable Heiken-Ashi candle indicator offering advanced visualization and calculation options for tracking market trends with enhanced flexibility.
Unemployment rate measures the percentage of jobless individuals seeking work, serving as a critical economic health indicator tracking labor market conditions and potential economic shifts.
An advanced market analysis indicator that visualizes buyer and seller strength through dynamic lines and moving averages, helping traders identify market pressure and potential trading opportunities.
Likes, views, and comments are historical TradingView snapshots. They describe attention, not trading performance.