3Commas Bot
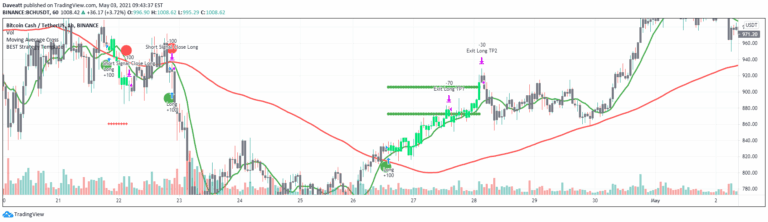
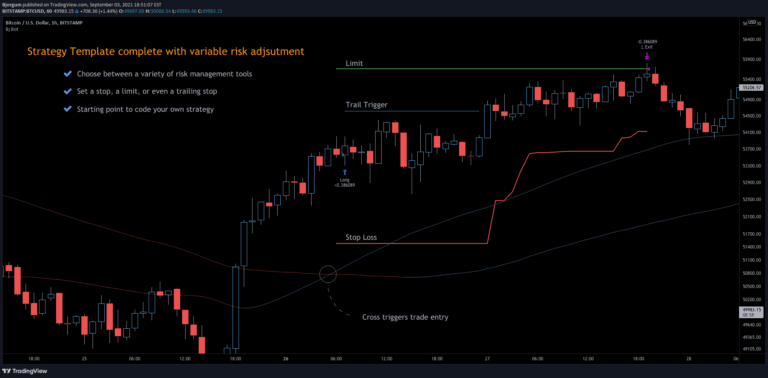
A 3Commas TradingView bot strategy offering automated trading with risk management, using moving average crossovers and customizable stop-loss and limit order settings.
Explore 11,183 indicators. Filter beyond the obvious.
Discover the tools that fit the way you trade.
11,183 tools to explore
A 3Commas TradingView bot strategy offering automated trading with risk management, using moving average crossovers and customizable stop-loss and limit order settings.
A universal strategy template for TradingView that allows traders to convert any indicator into a tradable strategy with comprehensive risk management and backtesting features.
A comprehensive trading framework designed to help traders develop, analyze, and manage trading strategies with advanced risk and reward tracking capabilities across multiple market conditions.
A trading tool that combines Fibonacci levels with volume profile analysis to provide insights into potential price movements and trading volume distribution across key market levels.
A unique trading indicator combining Murrey Math formulas with Fibonacci retracement levels to identify potential market tops, bottoms, and long-term trend dynamics with enhanced precision.
Fair value bands assess price behavior by tracking deviations from a mean basis, helping traders identify normal and abnormal price movements through dynamic statistical bands.
A sophisticated trading signal that combines trend detection, price rejection logic, and dynamic ATR-based target projection to identify and validate potential trend continuation opportunities.
A trading signal using Kadane's algorithm to identify the largest market impulse within a window, then applying Murrey's math lines to map potential price movements and trading opportunities.
The Gann Box is a technical analysis tool that uses geometric principles to identify potential support and resistance levels, forecast price movements, and analyze market trends.
FRAMA Channel is a dynamic trend-following indicator that adapts to market conditions, creating an adaptive channel around price to identify trend changes and market momentum.
A Pine Script color gradient generator that enables dynamic color generation for trading indicators, providing flexible visualization techniques for market analysis and signal representation.
The Supertrended RSI combines Relative Strength Index with Supertrend methodology to provide dynamic trend insights and trading signals across various financial markets.
Likes, views, and comments are historical TradingView snapshots. They describe attention, not trading performance.