YOUR INDICATOR RESEARCH STARTS HERE

Find the right indicator.
Understand what it does.

Explore 11,183 indicators. Filter beyond the obvious.
Discover the tools that fit the way you trade.

THE INDICATOR LIBRARY

Results for “hedging”

11,183 tools to explore

41 indicators matching your filters
Save search
TrendEditor’s pick

R:R Trading System Framework

by carnagecain

A comprehensive trading framework designed to help traders develop, analyze, and manage trading strategies with advanced risk and reward tracking capabilities across multiple market conditions.

Main price chart · unverifiedDay Trading · Swing Trading
Explore
5.3Klikes137.4Kviews128comments
Save
MomentumVolatilityEditor’s pick

Black-Scholes Options Pricing Model

by SegaRKO

A comprehensive options pricing and risk analysis tool using the Black-Scholes model, providing theoretical option prices, Greeks, and implied volatility for accurate options trading insights.

Separate pane · unverifiedDay Trading · Swing Trading
Explore
1.3Klikes40.3Kviews22comments
Save
SignalTrend

Correlation Clusters [LuxAlgo]

by LuxAlgo

A machine learning tool that groups tickers with similar correlation coefficients to help traders analyze asset relationships and optimize trading strategies.

Separate pane · unverifiedScalping · Day Trading
Explore
888likes13.3Kviews1comments
Save
SignalTrend

Historical Correlation [LuxAlgo]

by LuxAlgo

Historical Correlation tool calculates correlation coefficients between assets, revealing how different financial instruments move in relation to each other over time.

Separate pane · unverifiedScalping · Day Trading
Explore
693likes20.6Kviews4comments
Save
TrendVolatilityEditor’s pick

Correlation Heatmap

by TradingView

A correlation matrix indicator that calculates Pearson correlation coefficients between multiple financial instruments, revealing how different assets' returns move in relation to each other.

Separate pane · unverifiedSwing Trading
Explore
622likes22.8Kviews10comments
Save
TrendVolatilityEditor’s pick

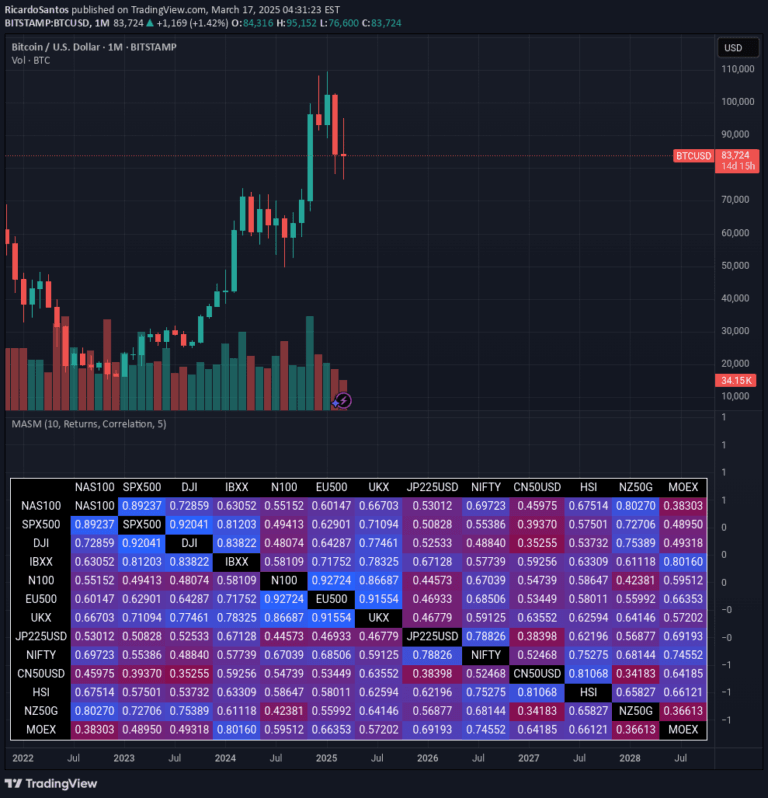
Multi Asset Similarity Matrix

by RicardoSantos

A market analysis tool that calculates and visualizes asset similarities using advanced mathematical measures, revealing complex relationships between different market indices through color-coded correlation metrics.

Separate pane · unverifiedDay Trading · Swing Trading
Explore
459likes21.7Kviews5comments
Save
TrendVolatilitySignalEditor’s pick

Bear Market Probability Model

by EdgeTools

A comprehensive multi-factor quantitative model that assesses systemic market risk by integrating 13 risk factors across macroeconomic, technical, sentiment, and market breadth dimensions.

Separate pane · unverifiedDay Trading · Swing Trading
Explore
344likes13.7Kviews11comments
Save
OscillatorSignalTrend

COT-index range

by IvarssonAnalytics

A trading signal analyzing Commercials' positioning in the Commitment of Traders (COT) report, revealing market sentiment through percentile-based range measurements.

Separate pane · unverifiedSwing Trading
Explore
144likes2.9Kviews1comments
Save
SignalTrend

Mxwll Hedge Suite [Mxwll]

by MXWLL-Capital-Trading

A trading tool that identifies the best negatively correlated asset for hedging by analyzing price correlations across different cryptocurrencies and determining precise hedge quantities.

Separate pane · unverifiedScalping · Day Trading
Explore
129likes5.1Kviews4comments
Save
Trend

Pearson Correlation [Mr_Rakun]

by Mr_Rakun

Pearson Correlation measures the statistical relationship between two assets' price movements, helping traders understand how different markets interact and potentially move together or inversely.

Separate pane · unverifiedSwing Trading
Explore
127likes1.5Kviews0comments
Save

Likes, views, and comments are historical TradingView snapshots. They describe attention, not trading performance.

START WITH A QUESTION

A little less searching.
A lot more understanding.

Tell DeepAlpha what you need. Get an explanation, a shortlist,
and a direct path to the indicators behind it.

Ask DeepAlpha