Market Structure Break & Order Block by EmreKb
A market structure break and order block indicator that identifies trend reversals by analyzing price action breakouts and key candle formations to signal potential trading opportunities.
Explore 11,183 indicators. Filter beyond the obvious.
Discover the tools that fit the way you trade.
11,183 tools to explore
A market structure break and order block indicator that identifies trend reversals by analyzing price action breakouts and key candle formations to signal potential trading opportunities.
A customizable trading indicator designed to identify ICT Killzones and track high and low price pivots during specific market sessions with configurable time windows.
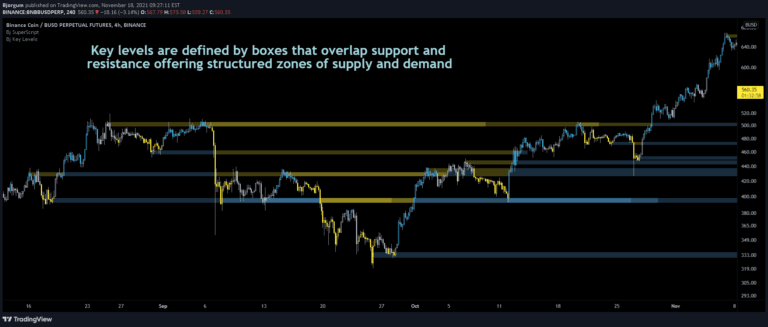
Key Levels strategy identifies critical price action points like breakouts, false breakouts, and backchecks to help traders understand market movement and potential trading opportunities.
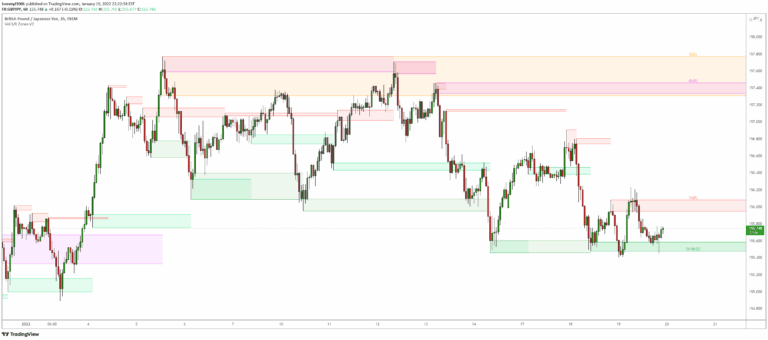
An advanced Support & Resistance indicator that identifies significant price zones using volume and fractal highs/lows, helping traders visualize potential trend reversals and continuations.
A liquidity indicator that highlights swing areas with trading activity, tracking price revisits, accumulated volume, and potential support/resistance zones using customizable filtering.
Breakout Probability indicator calculates the likelihood of new market highs or lows by analyzing historical price action and displaying percentage probabilities for potential price levels.
An advanced algorithmic indicator that automatically identifies and classifies complex chart patterns by analyzing trend lines, pivot points, and geometric formations across multiple timeframes.
A multi-timeframe support and resistance indicator that identifies key price levels, breakouts, tests, retests, and rejections to help traders understand market dynamics.
A comprehensive price action analysis tool that automatically identifies market structures, liquidity levels, order blocks, and potential trend shifts using pure price movement patterns.
A trading indicator that uses pivot points to identify supply and demand zones, market structure, and potential trading opportunities through visual analysis of price action.
Advanced trading indicator providing comprehensive market structure analysis with customizable sensitivities, identifying price action patterns, order blocks, and session dynamics for strategic trading decisions.
A trading indicator that identifies unique price patterns using Fair Value Gaps and Breaker Blocks, highlighting potential entry and exit points with risk/reward targets.
Likes, views, and comments are historical TradingView snapshots. They describe attention, not trading performance.