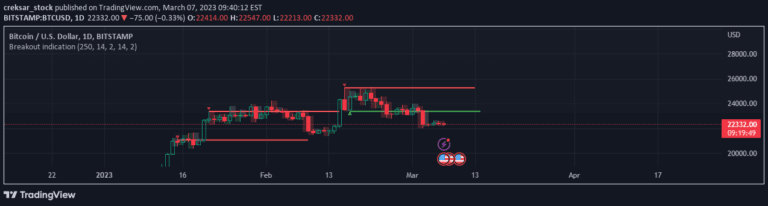
Range Identifier [LazyBear]
A range-based indicator that highlights price ranges to help identify potential breakouts and trading opportunities by visually marking key price levels and market movements.
Explore 11,183 indicators. Filter beyond the obvious.
Discover the tools that fit the way you trade.
11,183 tools to explore
A range-based indicator that highlights price ranges to help identify potential breakouts and trading opportunities by visually marking key price levels and market movements.
A sophisticated technical analysis tool using Arnaud Legoux Moving Average to identify market trends, smooth price data, and provide dynamic trend insights with visual enhancements.
A technical analysis script that identifies unique candlestick patterns with no bottom or top wicks, highlighting specific price action formations through visual markers and extended lines.
A dynamic trend identification indicator that uses volatility, momentum, and impulse filtering to detect high-probability market trend shifts and reversals with adaptive signal confirmation.
A volatility-based breakout indicator that identifies potential trading opportunities by tracking price movements and candle color changes, helping traders spot market entry and exit points.
An advanced pattern detection indicator that identifies regular and inverted horn chart patterns, highlighting breakout confirmation levels and potential take profit zones for traders.
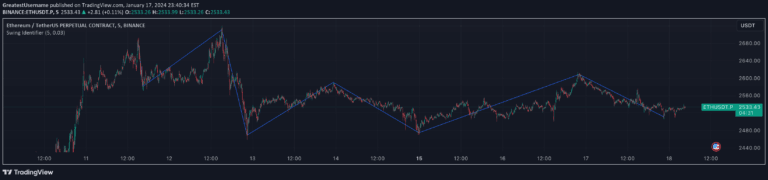
A custom Pine Script indicator that identifies and marks swing highs and lows on trading charts, helping traders visualize potential trend reversals and support/resistance zones.
An experimental Pine Script zigzag indicator using custom point types for tracking market direction and creating visual annotations on trading charts.
An advanced TradingView indicator designed to identify Fair Value Gaps in market price action, revealing critical market imbalances and potential trading opportunities with precision.
A trend identification tool using moving averages to highlight market direction, potential entry points, and trend changes through color-coded signals and flags.
A volatility indicator that identifies market consolidation phases by analyzing standard deviation and its derivative to detect periods of reduced price movement.
A quarter-based trading indicator that identifies significant price shifts by calculating percentage changes between quarterly closing prices and signaling movements exceeding 4%.
Likes, views, and comments are historical TradingView snapshots. They describe attention, not trading performance.