Weekly Options Expiry Candle V.2
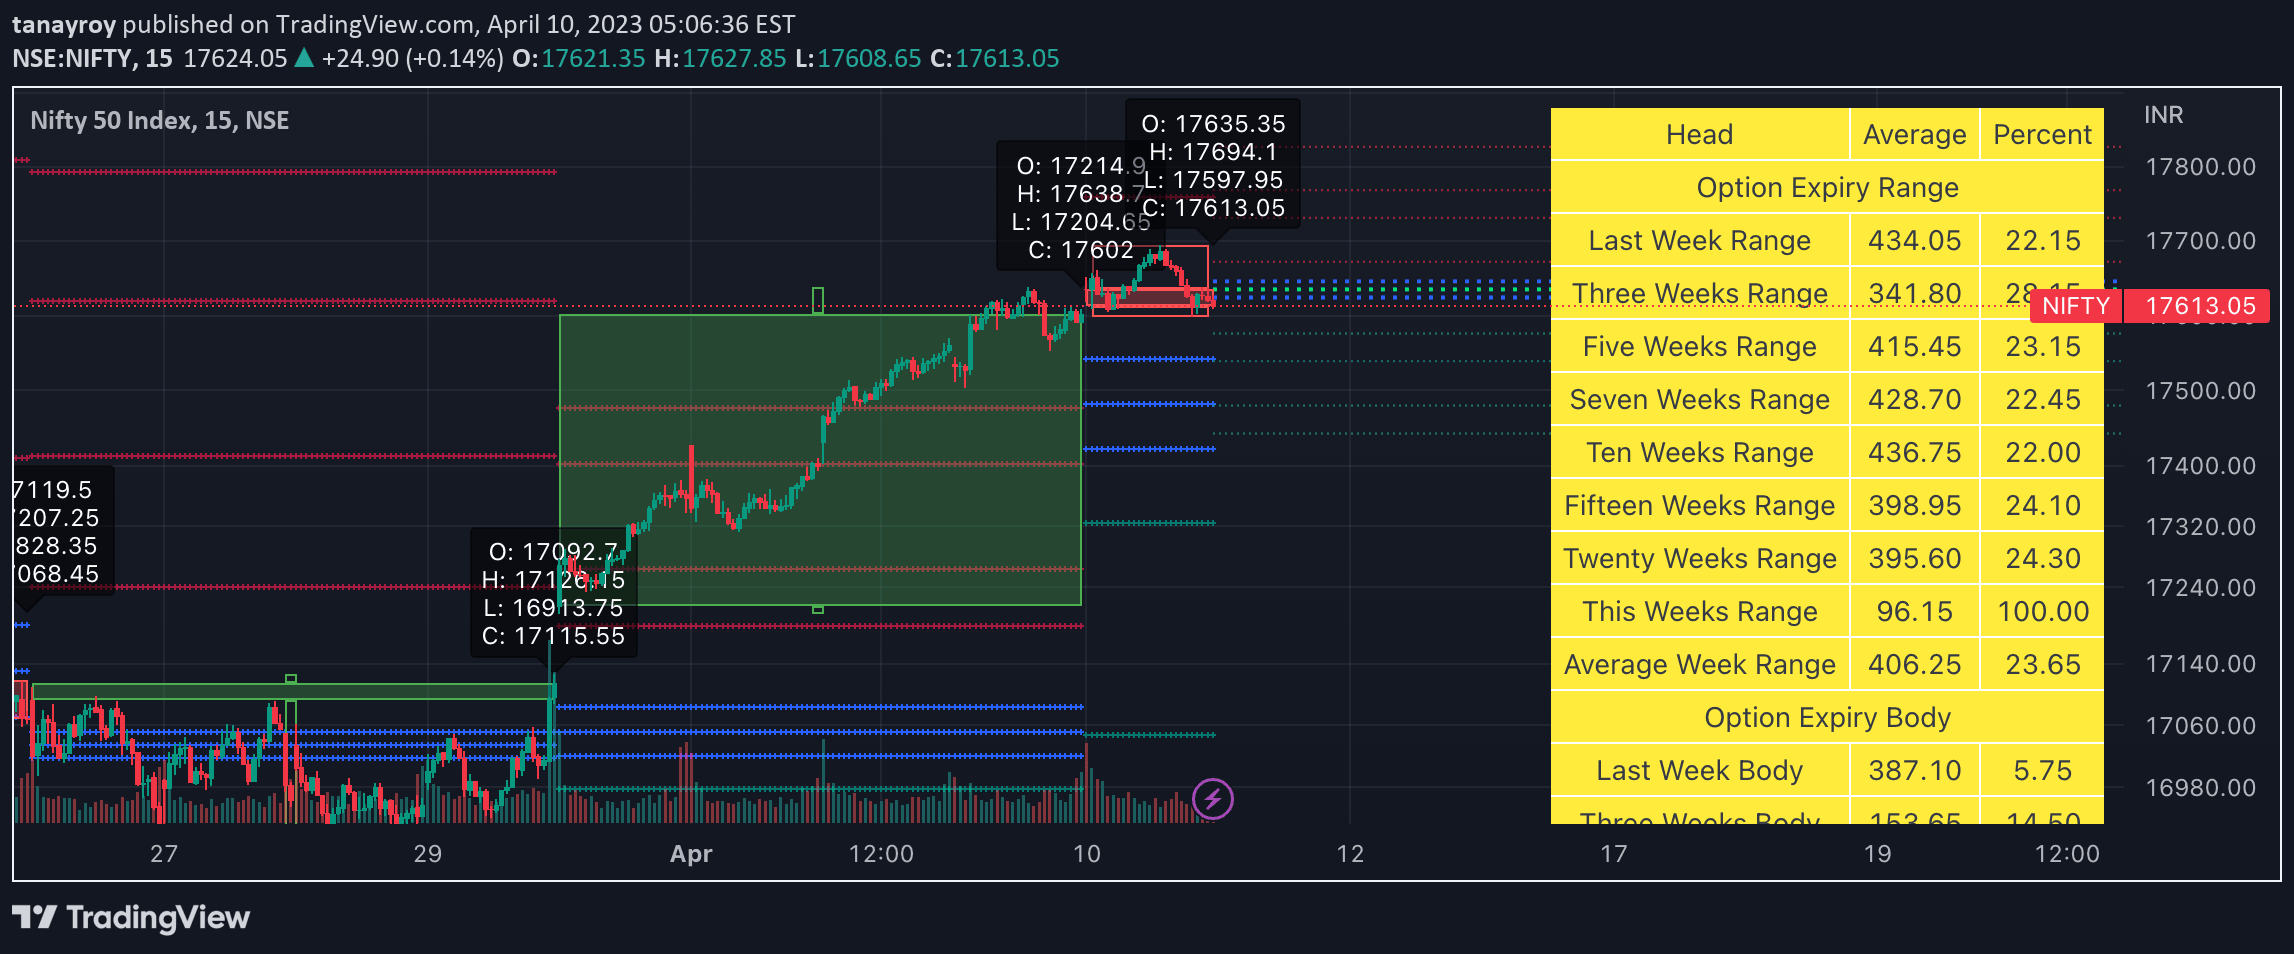
A trading tool that tracks weekly options expiry candles in India, providing visual insights into market movements, pivot points, and expiry-related statistical data for intraday trading.
Explore 11,183 indicators. Filter beyond the obvious.
Discover the tools that fit the way you trade.
11,183 tools to explore
A trading tool that tracks weekly options expiry candles in India, providing visual insights into market movements, pivot points, and expiry-related statistical data for intraday trading.
Tracks the combined balance sheets of major global central banks in USD, providing a comprehensive view of global monetary policy and liquidity conditions.
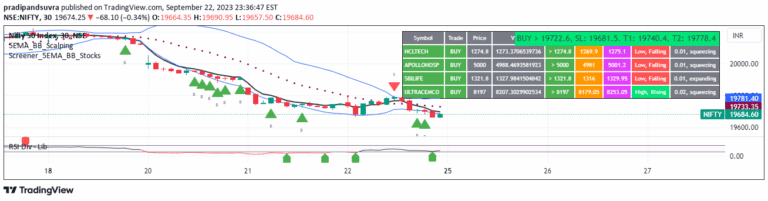
A dynamic trading scanner that identifies potential buy and sell signals for Nifty-50 stocks using 5-EMA and Bollinger Bands, providing real-time trade recommendations.
A trading strategy using India VIX to calculate potential high and low targets for BankNifty and Nifty by analyzing volatility across different timeframes.
A dynamic support and resistance indicator using VIX volatility that generates intraday trading levels to help traders identify potential entry and exit points based on market sentiment.
A trading session indicator for Indian stock markets that highlights volatility variations throughout the trading day, helping traders understand market dynamics and optimize strategy timing.
A trading strategy using support and resistance levels calculated based on the volatility index, helping traders identify potential price movement zones for the day.
A comprehensive Pine Script tool for analyzing options data across multiple symbols, providing cumulative performance visualization and dynamic profit/loss tracking on TradingView.
An ATR Trailing Stop Indicator that dynamically adjusts stop levels based on market volatility, helping traders manage trend-following strategies and protect capital during market reversals.
A reversal trading strategy using 5EMA and Bollinger Bands to identify potential entry and exit points across different timeframes and stocks.
An intraday trading indicator focused on detecting early price action patterns in Nifty and Bank Nifty markets, primarily during the first trading hour with specific bullish and bearish signal generation.
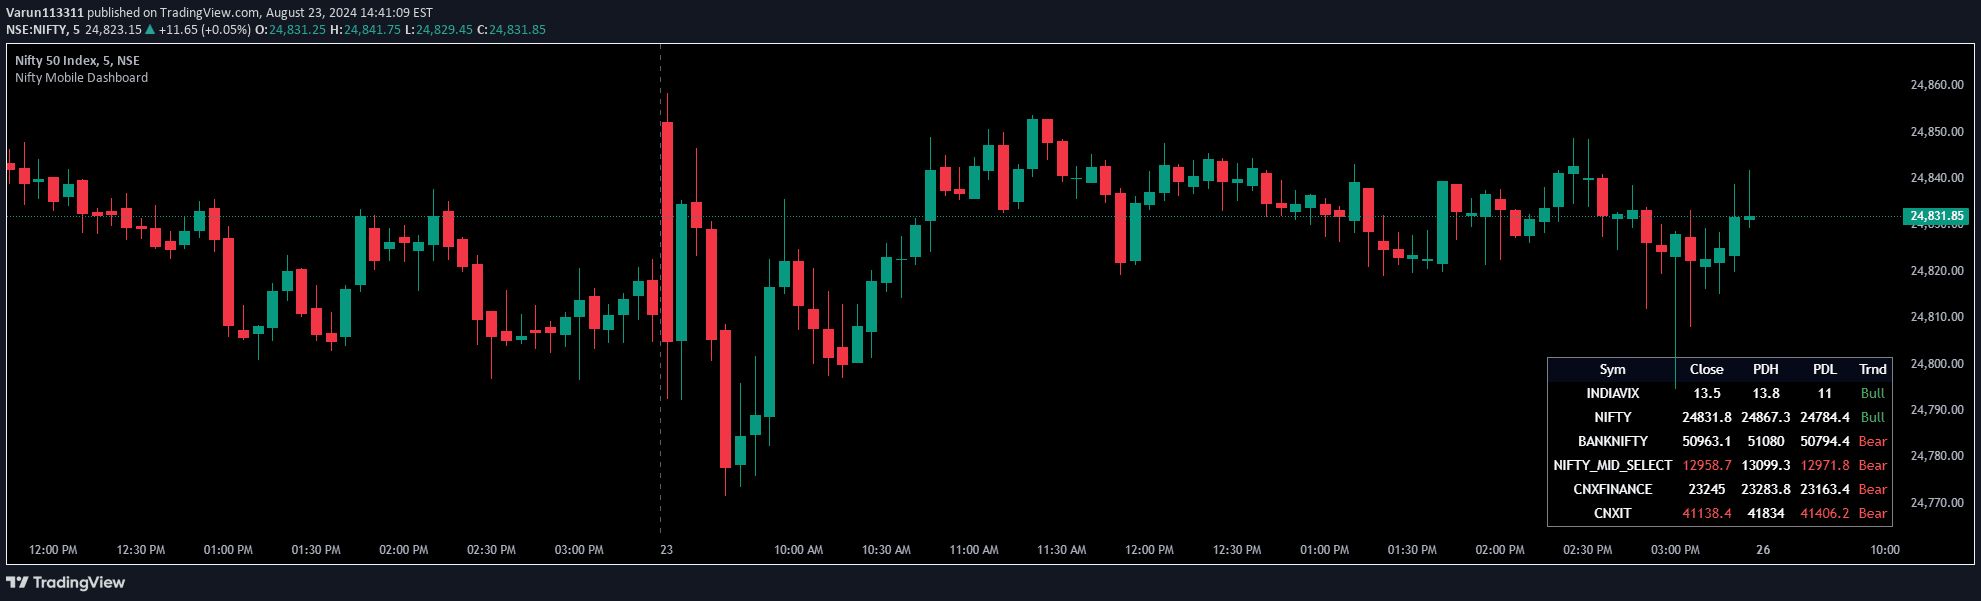
A mobile dashboard indicator that provides a compact table on TradingView charts, displaying key market data for up to six financial instruments with customizable settings.
Likes, views, and comments are historical TradingView snapshots. They describe attention, not trading performance.