YOUR INDICATOR RESEARCH STARTS HERE

Find the right indicator.
Understand what it does.

Explore 11,183 indicators. Filter beyond the obvious.
Discover the tools that fit the way you trade.

THE INDICATOR LIBRARY

Results for “layers”

11,183 tools to explore

97 indicators matching your filters
Save search
TrendMomentumEditor’s pick

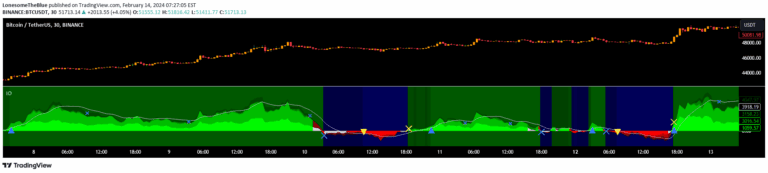
Ichimoku Oscillator

by LonesomeTheBlue

Ichimoku Oscillator is a multi-layered technical analysis tool that evaluates market trends using Ichimoku Cloud features, providing insights into potential entry and exit points.

Separate paneDay Trading · Swing Trading
Explore
5.1Klikes144.7Kviews149comments
Save
LevelsTrendVolume

Range Analysis - By Leviathan

by LeviathanCapital

An advanced trading tool that analyzes price ranges by automatically drawing range levels, volume profiles, and various analytical tools to help traders understand market structure and potential price movements.

Main price chart · unverifiedScalping · Day Trading
Explore
4.7Klikes89.1Kviews41comments
Save
TrendSignal

ICT HTF Candles [Source Code] (fadi)

by fadizeidan

A configurable higher timeframe indicator that allows visualization of price movement, Fair Value Gaps, and Volume Imbalance across multiple timeframes for strategic trading analysis.

Main price chart · unverifiedScalping · Day Trading
Explore
3.1Klikes53.6Kviews128comments
Save
MomentumSignalVolatility

Squeeze Momentum Deluxe

by EliCobra

A comprehensive trading toolkit that combines momentum, volatility, and price action analysis to provide insights into market trends, momentum, and potential reversals.

Separate pane · unverifiedScalping · Day Trading
Explore
2.6Klikes47.1Kviews26comments
Save
MomentumOscillatorTrend

Enhanced McClellan Summation Index

by EliCobra

A comprehensive market breadth indicator combining McClellan Summation Index with Heikin-Ashi visualization and MACD analysis to provide advanced trend and momentum insights.

Separate pane · unverifiedDay Trading · Swing Trading
Explore
1.3Klikes19Kviews5comments
Save
TrendSignalLevels

Market Structure

by mezor13

An advanced market structure indicator that detects swing highs and lows across multiple timeframes, providing robust insights into market dynamics and trend identification.

Main price chart · unverifiedScalping · Day Trading
Explore
1.1Klikes20.2Kviews24comments
Save
TrendVolatilitySignal

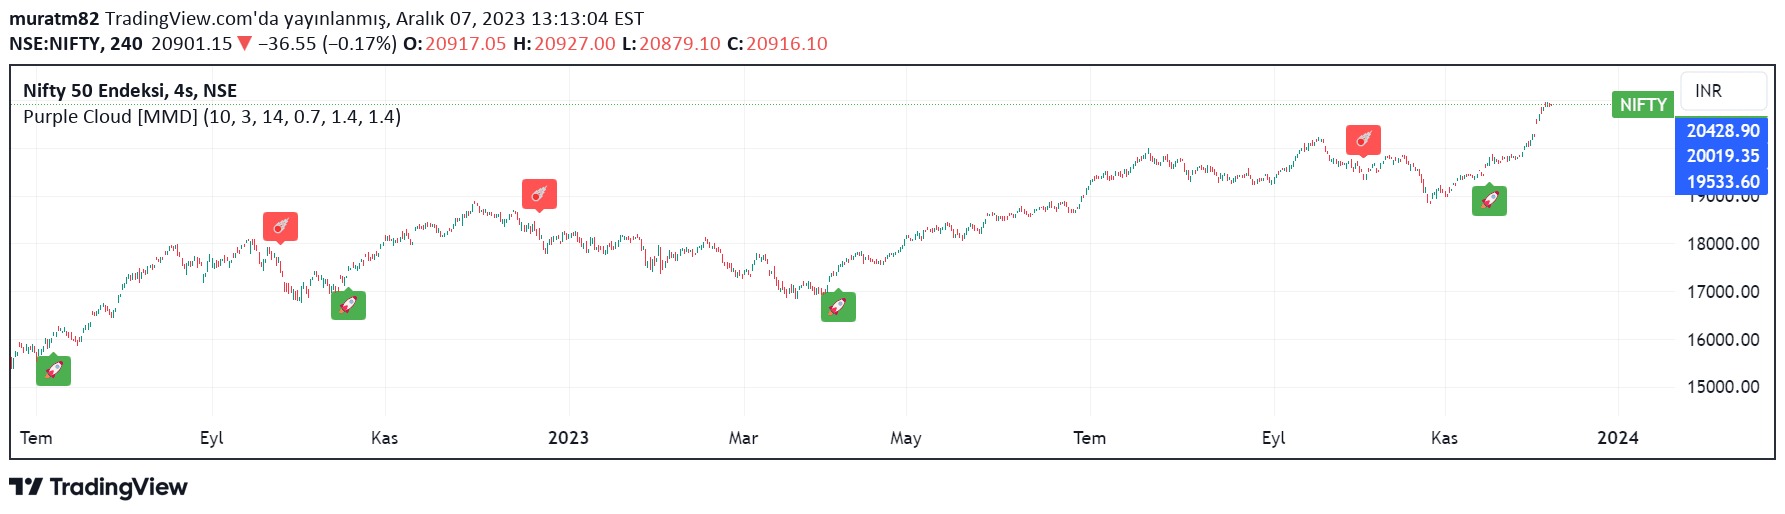
Purple Cloud

by muratm82

A complex trading signal that calculates modified moving averages and creates multiple displaced plots using price and volatility parameters to generate potential trading insights.

Main price chart · unverifiedScalping · Day Trading
Explore
1.1Klikes38.6Kviews52comments
Save
SignalTrendVolatility

LinReg Heikin Ashi Candles

by B3AR_Trades

A sophisticated trading indicator combining Heikin Ashi candles with Linear Regression to create a smoothed, trend-focused chart overlay that reduces market noise and highlights price momentum.

Main price chart · unverifiedScalping · Day Trading
Explore
916likes14Kviews11comments
Save
MomentumOscillatorSignal

[COG]StochRSI Zenith

by CognitiveAlpha

StochRSI Zenith is a sophisticated technical indicator that combines Stochastic RSI with advanced visualization and multi-timeframe analysis for comprehensive market condition assessment.

Separate pane · unverifiedScalping · Day Trading
Explore
888likes10.8Kviews5comments
Save
FundamentalSignalTrend

Analytics Trading Dashboard

by Amphibiantrading

A comprehensive trading dashboard that aggregates critical company information, fundamental data, price metrics, and analyst ratings into a single, easy-to-view analytical tool.

Main price chart · unverifiedDay Trading · Swing Trading
Explore
590likes11.1Kviews12comments
Save

Likes, views, and comments are historical TradingView snapshots. They describe attention, not trading performance.

START WITH A QUESTION

A little less searching.
A lot more understanding.

Tell DeepAlpha what you need. Get an explanation, a shortlist,
and a direct path to the indicators behind it.

Ask DeepAlpha