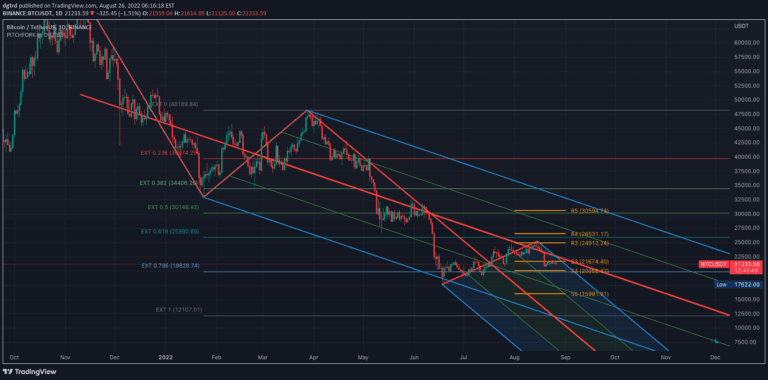
Auto Pitchfork, Fib Retracement and Zig Zag by DGT
Pitchfork is a technical indicator that helps traders identify potential support and resistance levels by drawing trend lines based on three strategic points in price movement.
Explore 11,183 indicators. Filter beyond the obvious.
Discover the tools that fit the way you trade.
11,183 tools to explore
Pitchfork is a technical indicator that helps traders identify potential support and resistance levels by drawing trend lines based on three strategic points in price movement.
Central Pivot Range (CPR) is a forecasting tool that calculates pivot points from previous trading sessions to predict market trends, volatility, and potential support and resistance levels.
Camarilla Pivot Points indicator that automatically calculates and suggests trading plays using daily pivot levels, providing entry, stop-loss, and target points for traders.
A multi-functional candlestick overlay that provides various visualization options and buy/sell signals using different technical indicators to help traders identify market trends and potential entry/exit points.
A comprehensive trading signal combining multiple indicators like EMA, VWAP, SuperTrend, and Elder Impulse System to provide trend, momentum, and trading insights.
A personal trading hours indicator that allows traders to define and visualize specific time windows for trading across different days of the week.
An exploration of array manipulation in Pine Script, demonstrating how developers can handle multiple data sources and visual elements within trading indicator development.
A powerful trading indicator that identifies market conditions and potential breakout opportunities using Camarilla pivots, helping traders recognize trend formations and key support/resistance levels.
A multi-timeframe moving average ribbon that dynamically tracks market trends using EMA and SMA with customizable lengths and visual indicators.
Supercloud is a dynamic moving average trend representation that uses multiple MA's referenced to EMA 200 to analyze price movement and trend strength across different timeframes.
A pivot point indicator that helps traders identify potential next-day price levels and support/resistance zones using Camarilla pivot calculations for strategic trading decisions.
An enhanced version of Cam pivot points with additional R5/S5 and S5/S6 levels, providing more granular support and resistance zones for technical analysis.
Likes, views, and comments are historical TradingView snapshots. They describe attention, not trading performance.