COT CFTC
Advanced tool analyzing CFTC Commitments of Traders data to provide comprehensive market insights through visualization of large speculators, commercial positions, and market sentiment indicators.
Explore 11,183 indicators. Filter beyond the obvious.
Discover the tools that fit the way you trade.
11,183 tools to explore
Advanced tool analyzing CFTC Commitments of Traders data to provide comprehensive market insights through visualization of large speculators, commercial positions, and market sentiment indicators.
A trading indicator that identifies price ranges by analyzing candle patterns and market equilibrium zones, helping traders spot potential trading opportunities during calm market conditions.
A price reversal detection indicator using the Fisher Transform to convert price data into a normalized distribution, helping traders identify potential trend changes and breakout opportunities.
A market indicator analyzing Commitment of Traders (COT) report data to track net positions and market sentiment across various futures contracts and asset classes.
A trading signal that identifies premium and discount zones by comparing the opening price with high and low prices using predefined thresholds. Plots green and red triangles to indicate market conditions.
A script that plots trading sessions for New York and London markets, helping traders identify key market periods and potential trading opportunities across different time zones.
A dynamic moving average that weights price calculations by volatility, providing a more nuanced trend filter that adapts to market conditions and potential price significance.
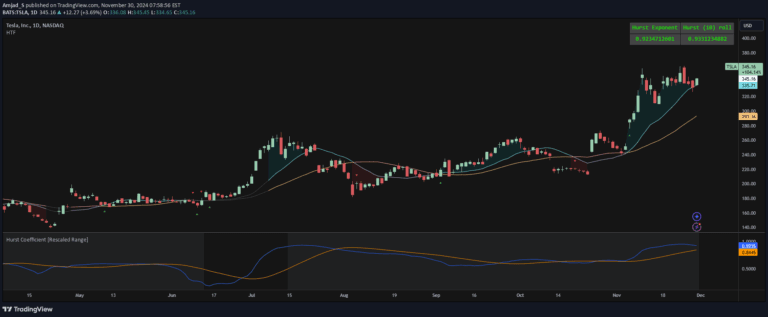
A trading indicator using the Hurst Exponent to categorize market states, identifying trending, random, and mean-reverting markets by analyzing time series auto-correlation.
A forecasting indicator that uses volatility and frequency distributions to predict potential price expansion zones with confidence intervals and significance levels.
A liquidity zone indicator that tracks Highest High and Lowest Low to identify potential market order accumulation points and institutional price targeting strategies.
VWAP is a trading indicator that calculates the average trading price weighted by volume, helping traders identify market trends and liquidity zones across different timeframes.
Dynamic Trailing Support & Resistance (DTSR) is an objective method for identifying support and resistance zones using calculated range thresholds and Fibonacci retracement levels.
Likes, views, and comments are historical TradingView snapshots. They describe attention, not trading performance.