YOUR INDICATOR RESEARCH STARTS HERE

Find the right indicator.
Understand what it does.

Explore 11,183 indicators. Filter beyond the obvious.
Discover the tools that fit the way you trade.

THE INDICATOR LIBRARY

Results for “move”

11,183 tools to explore

379 indicators matching your filters
Save search
VolumeLevels

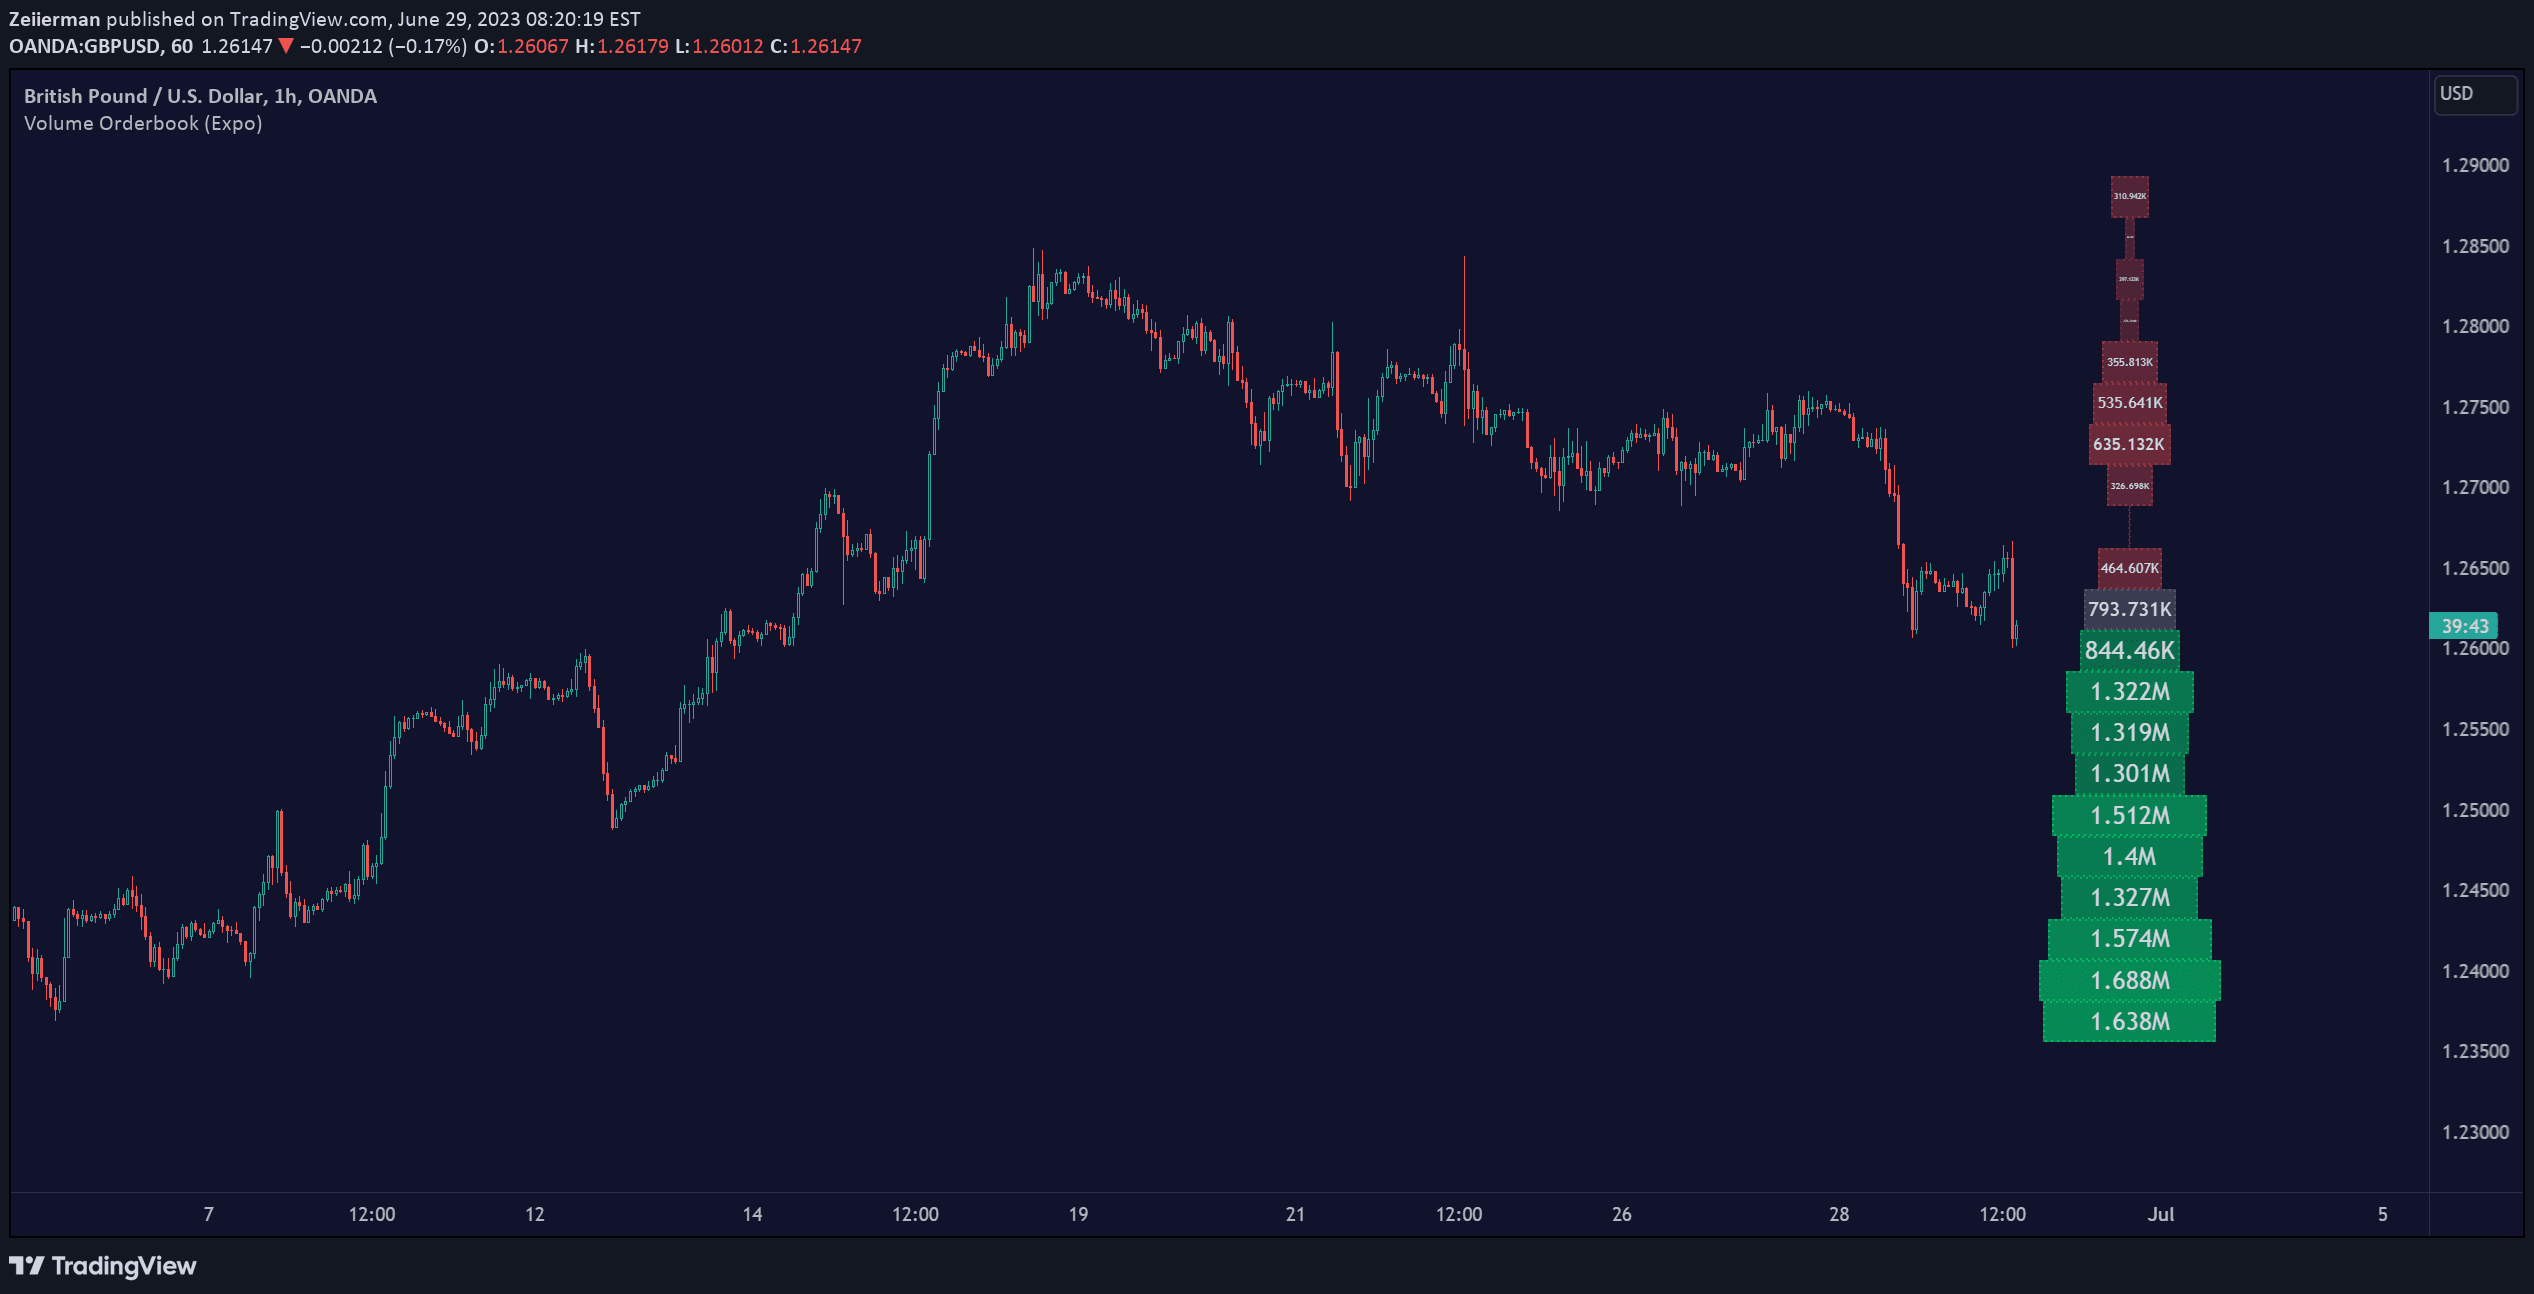
Volume Orderbook (Expo)

by Zeiierman

Volume Orderbook is a visual trading tool that displays trading volume across different price levels, helping traders identify significant market activity zones and potential support/resistance areas.

Separate pane · unverifiedScalping · Day Trading
Explore
8.4Klikes192.3Kviews127comments
Save
PatternsSignalTrend

2B Reversal Pattern (Expo)

by Zeiierman

The 2B reversal pattern identifies potential market trend reversals by detecting false breakouts and price rebounds, signaling opportune entry points for traders.

Main price chart · unverifiedScalping · Day Trading
Explore
7.3Klikes147.6Kviews60comments
Save
PatternsSignal

Swing Breakout Sequence [LuxAlgo]

by LuxAlgo

A price action scalping sequence identifying potential breakout opportunities by detecting two unsuccessful breakouts in the same direction, anticipating a third decisive move.

Main price chart · unverifiedScalping · Day Trading
Explore
5Klikes80.9Kviews29comments
Save
PatternsSignalVolatility

NR4 & NR7 with Breakouts [LuxAlgo]

by LuxAlgo

NR4 & NR7 is a pattern recognition indicator that identifies narrow range candles to detect potential market breakouts and low volatility transitions.

Main price chart · unverifiedScalping · Day Trading
Explore
3.6Klikes54.5Kviews16comments
Save
MomentumOscillatorSignal

Parabolic RSI [ChartPrime]

by ChartPrime

Parabolic RSI combines Parabolic SAR with Relative Strength Index to identify momentum shifts and potential trend reversals using a unique diamond-based signal system.

Separate pane · unverifiedScalping · Day Trading
Explore
3.4Klikes45Kviews17comments
Save
TrendMomentumEditor’s pick

Bitcoin Bullish Percent Index

by LonesomeTheBlue

Bullish Percent Index measures the percentage of securities on Point & Figure buy signals, providing a breadth indicator for market sentiment and potential trend reversals across multiple assets.

Separate pane · unverifiedDay Trading · Swing Trading
Explore
3.1Klikes59.4Kviews56comments
Save
MomentumOscillatorSignal

Edri Extreme Points Buy & Sell

by spudow

A trading indicator that combines CCI/Momentum and RSI to identify potential market reversals by detecting extreme price points and momentum shifts.

Separate pane · unverifiedScalping · Day Trading
Explore
2.8Klikes65.8Kviews55comments
Save
Trend

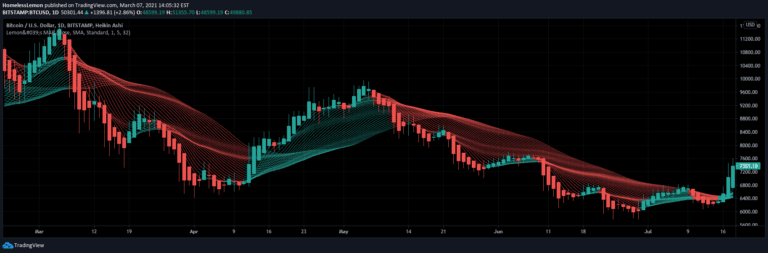
Customizable MA Ribbon

by HomelessLemon

A customizable moving average ribbon indicator that helps traders analyze trend strength and direction by plotting multiple moving averages with adjustable parameters and visual themes.

Main price chart · unverifiedDay Trading · Swing Trading
Explore
2.6Klikes37.9Kviews12comments
Save
TrendVolatilityEditor’s pick

SPY Expected Move by VIX

by AlgoXOR

A volatility indicator using VIX to measure price deviation from VWAP, primarily designed for SPY. It calculates standard deviation moves based on implied volatility, helping traders understand potential price ranges.

Main price chart · unverifiedDay Trading · Swing Trading
Explore
2.6Klikes52.6Kviews47comments
Save

Likes, views, and comments are historical TradingView snapshots. They describe attention, not trading performance.

START WITH A QUESTION

A little less searching.
A lot more understanding.

Tell DeepAlpha what you need. Get an explanation, a shortlist,
and a direct path to the indicators behind it.

Ask DeepAlpha