Ehlers Loops [BigBeluga]
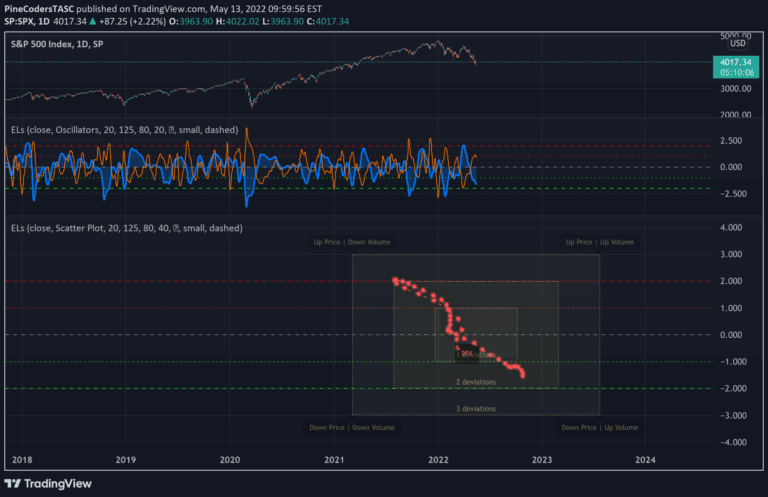
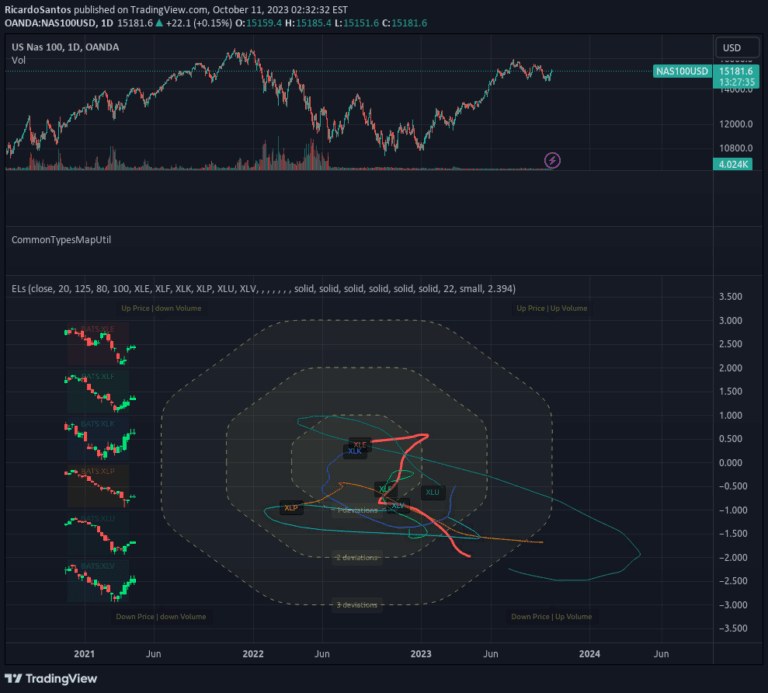
The Ehlers Loops indicator reveals price and volume dynamics through a quadrant-based visual representation, helping traders understand market momentum and potential trend reversals.
Explore 11,183 indicators. Filter beyond the obvious.
Discover the tools that fit the way you trade.
11,183 tools to explore
The Ehlers Loops indicator reveals price and volume dynamics through a quadrant-based visual representation, helping traders understand market momentum and potential trend reversals.
A technical indicator using zero-lag EMA and dynamic trend analysis to track market momentum, providing adaptive signals for trend identification and potential reversals.
A sophisticated trading indicator combining Gaussian-weighted moving average with a loop-based scoring system to identify trend strength and potential market reversals with precision.
Advanced Stochastic ForLoop is an improved stochastic indicator that calculates trend signals by analyzing price movements across multiple moving average lengths and signal modes.
An advanced trading indicator using Gaussian Moving Average with adaptive volatility and a for-loop scoring mechanism to detect dynamic market trends and potential signal opportunities.
The Hull For Loop indicator combines Hull Moving Average with a dynamic loop-based scoring system to detect trend changes and assess market momentum with customizable parameters.
A dynamic trend indicator using Directional Movement Index (DMI) that calculates trend signals across multiple length parameters with customizable signal modes.
A mathematical trading indicator using Fourier transforms to analyze market cycles and generate trend signals by decomposing price movements into frequency components.
Ehlers Loops is an advanced visualization technique that compares filtered and scaled price and volume data to reveal potential market conditions and trading insights.
A market analysis indicator using mode calculation and loop-based scoring to detect trend strength, providing dynamic insights into price momentum and potential market reversals.
A quartile-based trend-following oscillator that uses advanced scoring logic to detect momentum shifts and trend transitions across different market conditions.
An expanded crocker graph visualization technique that tracks multiple tickers simultaneously, providing a comprehensive market overview with embedded commodity candle details.
Likes, views, and comments are historical TradingView snapshots. They describe attention, not trading performance.