Bayesian Trend Indicator [ChartPrime]
A sophisticated trading indicator using Bayesian probability theory and multiple moving averages to assess market trends and predict potential price direction with statistical precision.
Explore 11,183 indicators. Filter beyond the obvious.
Discover the tools that fit the way you trade.
11,183 tools to explore
A sophisticated trading indicator using Bayesian probability theory and multiple moving averages to assess market trends and predict potential price direction with statistical precision.
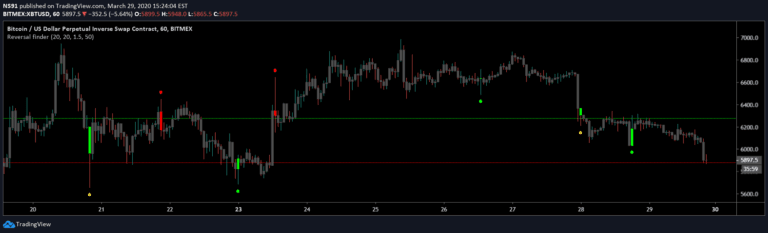
A trading signal that identifies potential price reversals by analyzing false breakouts of support and resistance levels through range and position analysis of price bars.
An indicator that automatically marks prior day and pre-market high and low levels across the entire trading session, helping traders identify key price reference points.
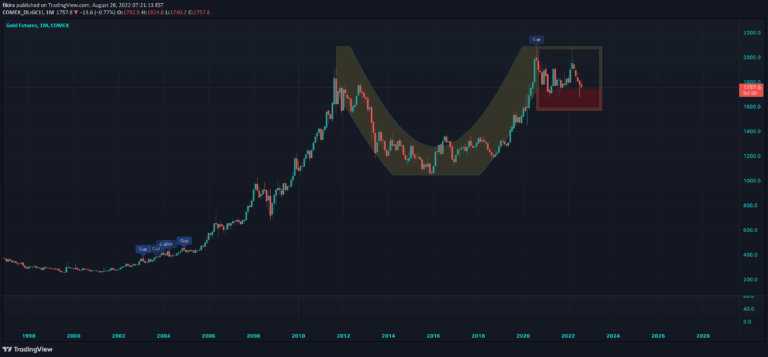
Cup & Handle is a technical chart pattern that identifies potential bullish trend continuation by analyzing price movements and pivot points, revealing possible upward breakout opportunities.
A volatility-based indicator that identifies price contraction periods by analyzing band narrowing and price behavior, signaling potential upcoming market movements.
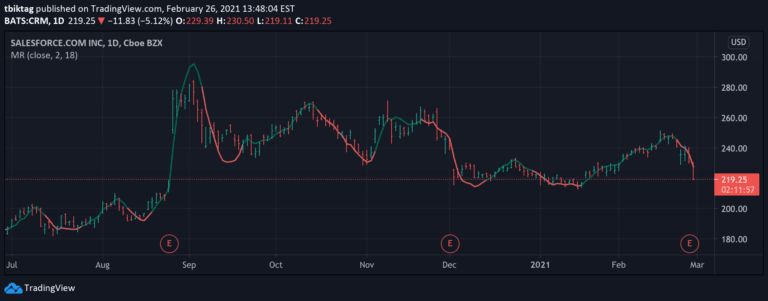
Moving Regression is a flexible trend analysis method that approximates data points using polynomial functions to smooth noise, assess momentum, and predict trend direction.
Session-based candles track price movements within specific global trading sessions, identifying session reversals and analyzing their performance using historical backtesting metrics.
An analytical approach tracking consecutive bars to identify potential market exhaustion and trend shifts by monitoring price movements across multiple periods.
Position Cost Distribution estimates share allocation across price levels by tracking daily trade volume and inferring share transfers between price ranges.
An advanced trading tool that automatically plots opening range and previous day's high/low levels to help traders identify potential market sentiment and trading opportunities.
A candlestick-based trading indicator that identifies engulfing patterns to predict potential price reversals and trading zones using visual lines and areas on the chart.
A signal that identifies potential market gaps and liquidity zones by analyzing price action between current and previous candles, highlighting areas where significant order activity might exist.
Likes, views, and comments are historical TradingView snapshots. They describe attention, not trading performance.