Bjorgum Double Tap
Double Tap is a pattern recognition strategy that identifies double top and double bottom formations, providing entry signals based on price action reversals and breakout patterns.
Explore 11,183 indicators. Filter beyond the obvious.
Discover the tools that fit the way you trade.
11,183 tools to explore
Double Tap is a pattern recognition strategy that identifies double top and double bottom formations, providing entry signals based on price action reversals and breakout patterns.
A future-trend analysis tool that projects potential price direction by examining three consecutive periods, using price averages and volume delta to forecast market movement.
A predictive indicator that estimates maximum and minimum price levels within a specified trading session, providing support/resistance insights and hit rate probabilities for traders.
An advanced trading indicator that analyzes price ranges within specific time sessions by measuring standard deviation extensions and tracking price interactions with projected levels.
ABCD Projection Indicator identifies and projects ABCD chart patterns using a Zigzag-based approach, helping traders spot potential trend continuation opportunities in financial markets.
A multi-timeframe analysis tool that projects higher timeframe candle information onto the current chart, enabling simultaneous visualization of different timeframe price movements and patterns.
Smart Trend Lines is a multi-level trend classification tool that detects market trends by drawing dynamic trend lines and validating breakouts using volume, ADX, and RSI filters.
A custom trading indicator that tracks session-based OHLC statistics, analyzing price action within defined time ranges and calculating manipulation and distribution levels for strategic trading insights.
A comprehensive trading calculator that helps traders assess risk, potential profits, and strategic entry points by analyzing trade parameters and providing visual insights.
A unique moving average technique that creates average lines by connecting pivot points and extending them into the future, offering a dynamic way to analyze market trends and potential price movements.
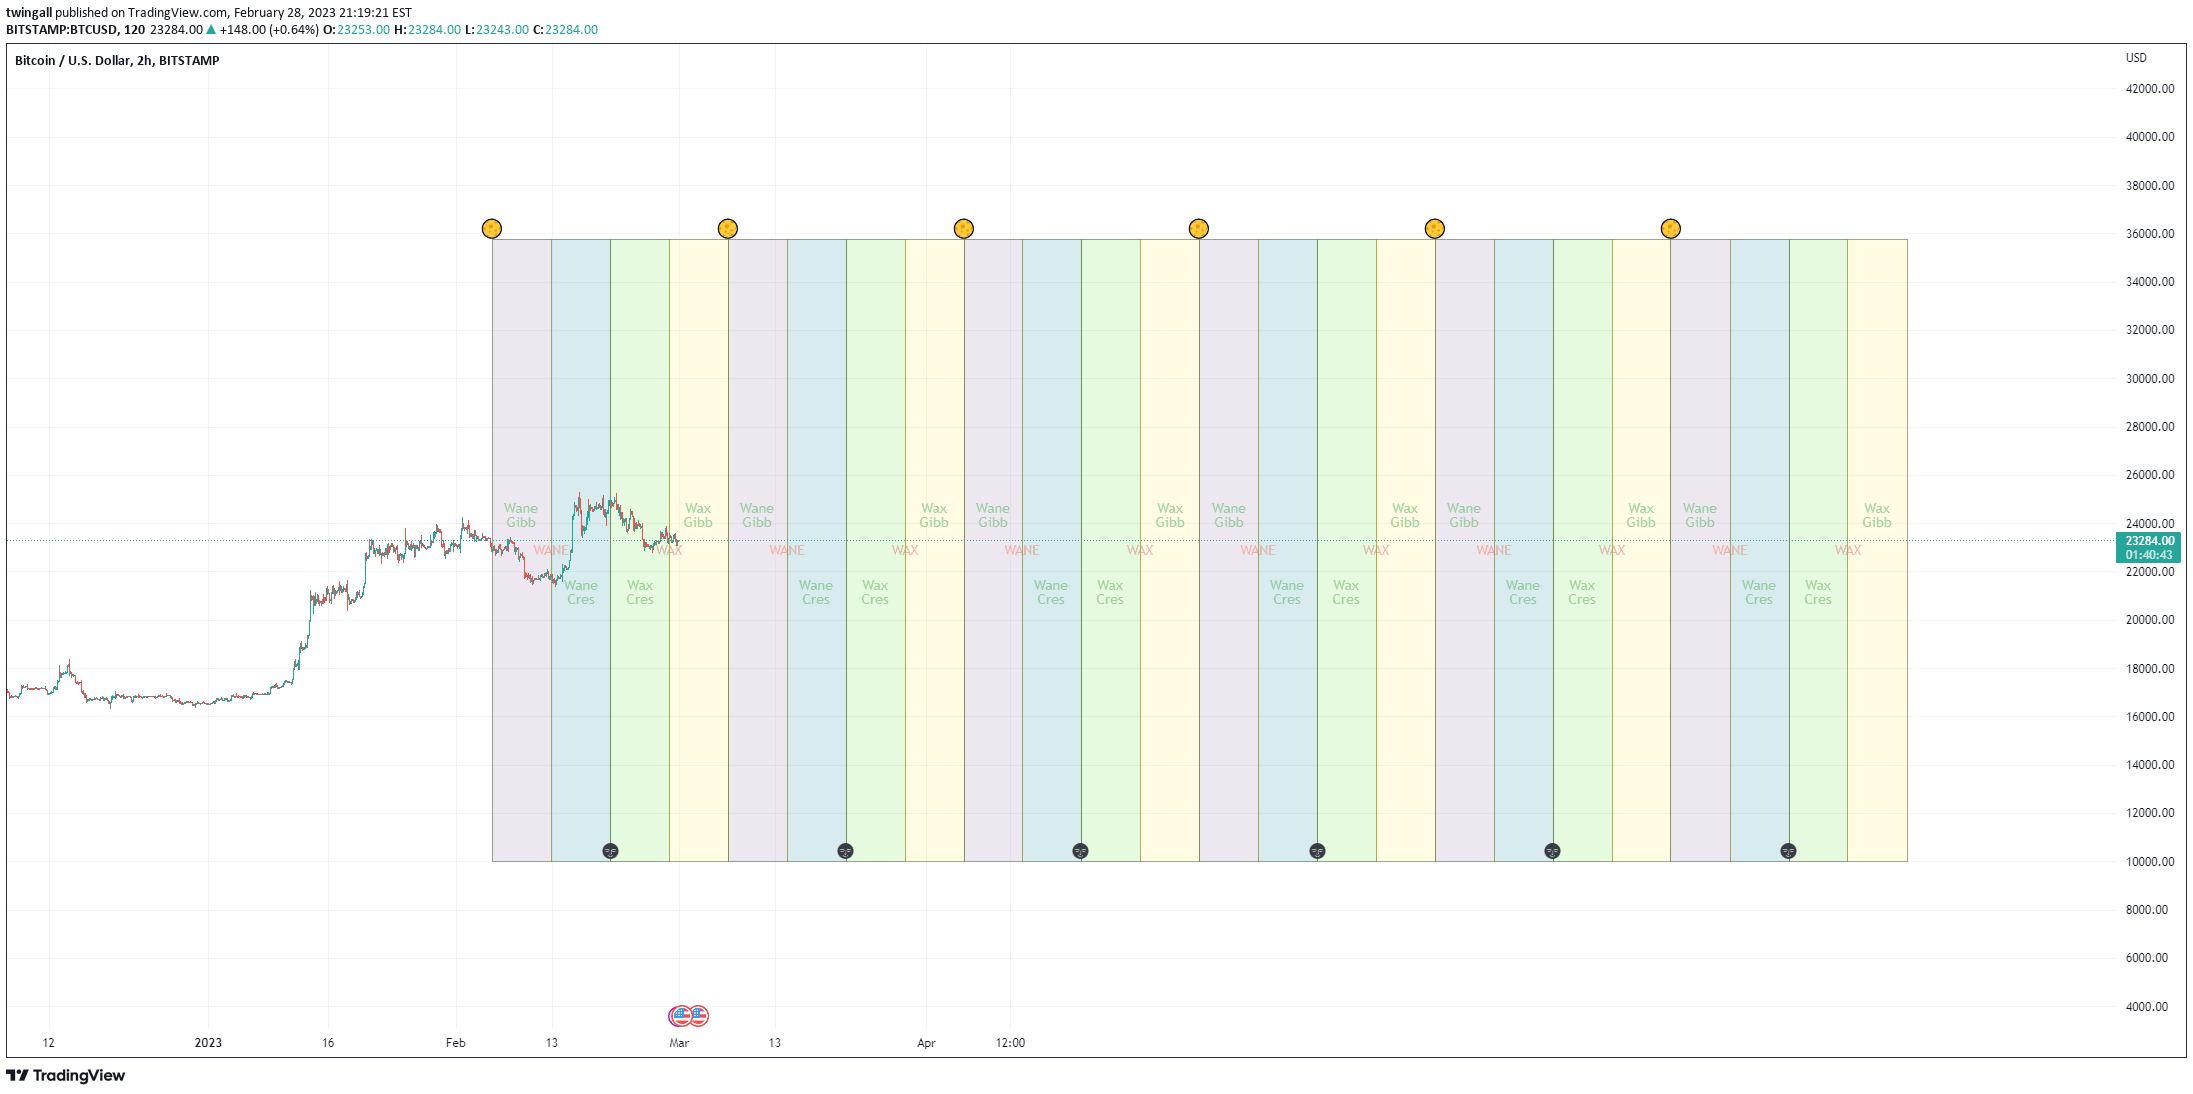
A lunar cycle projection tool that helps traders anticipate potential market rhythms by mapping future lunar phases based on a user-selected historical full moon reference point.
A novel moving average technique that reduces lag by projecting price movement using linear regression, helping traders identify trend shifts more responsively.
Likes, views, and comments are historical TradingView snapshots. They describe attention, not trading performance.