Global Liquidity Index
Global Liquidity Index tracks worldwide central bank balance sheets, providing a comprehensive view of global monetary conditions and potential market trends through consolidated financial data.
Explore 11,183 indicators. Filter beyond the obvious.
Discover the tools that fit the way you trade.
11,183 tools to explore
Global Liquidity Index tracks worldwide central bank balance sheets, providing a comprehensive view of global monetary conditions and potential market trends through consolidated financial data.
Fair value bands assess price behavior by tracking deviations from a mean basis, helping traders identify normal and abnormal price movements through dynamic statistical bands.
An advanced technical indicator using dual EMAs and volatility-adjusted bands to detect market trends, providing dynamic and adaptive trend analysis across different market conditions.
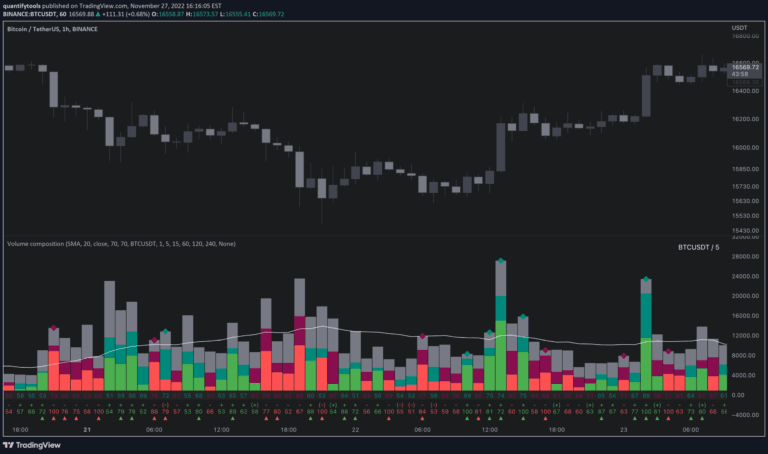
Volume composition indicator that breaks down trading volume into buy, sell, passive, and active components to provide deeper insights into market liquidity and potential price movements.
A comprehensive trading tool combining order blocks and Fibonacci retracements to identify potential market entry and exit points based on significant order zones and mathematical support/resistance levels.
A custom trading tool that generates monthly and yearly performance tables for trading strategies, helping traders analyze historical strategy performance and identify key periods of success or weakness.
Trendline Pivot Indicator automatically draws and recognizes dynamic trend lines connecting pivot highs and lows, providing visual support and resistance reference points on price charts.
A technical indicator using zero-lag EMA and dynamic trend analysis to track market momentum, providing adaptive signals for trend identification and potential reversals.
TPOC & VPOC identify key market price points with the highest trading time and volume, revealing market participant interest and potential trend dynamics.
A neural network-enhanced RSI indicator that uses advanced smoothing techniques to generate precise trading signals across different market conditions and visualization modes.
A comprehensive trend-following indicator using moving averages to identify bullish and bearish market trends across different timeframes with color-coded visual alerts.
A machine learning-enhanced RSI indicator that dynamically adapts overbought and oversold thresholds using clustering techniques, providing more precise trading signals across different market conditions.
Likes, views, and comments are historical TradingView snapshots. They describe attention, not trading performance.