Quarterly Earnings
A TradingView script that displays quarterly earnings per share and sales data with year-on-year percentage changes, offering customizable visualization of financial performance metrics.
Explore 11,183 indicators. Filter beyond the obvious.
Discover the tools that fit the way you trade.
11,183 tools to explore
A TradingView script that displays quarterly earnings per share and sales data with year-on-year percentage changes, offering customizable visualization of financial performance metrics.
A financial analysis tool that compares quarterly, annual, and TTM performance metrics, providing comprehensive insights into company growth through various financial indicators and visualization options.
A comprehensive trading tool that compares fundamental metrics across multiple assets using various charting methods, enabling detailed financial analysis and visualization.
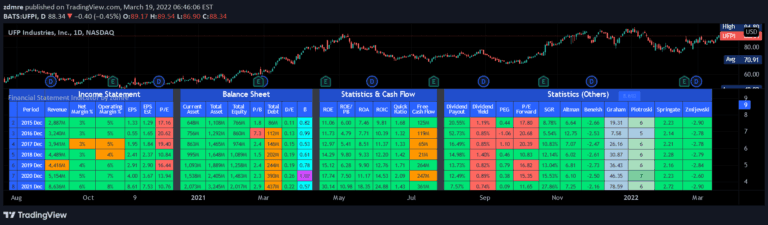
A comprehensive financial analysis tool that combines key financial statement metrics to assess a company's financial health, performance, and investment potential across income, balance sheet, and cash flow dimensions.
A fair value calculator that estimates a stock's intrinsic worth by analyzing revenue growth, profit margins, and key financial metrics to help investors identify undervalued or overvalued stocks.
A Pine Script indicator that analyzes financial performance by tracking EPS, sales growth, and stock price changes to help traders make informed investment decisions.
A financial indicator analyzing key growth metrics like earnings per share, revenue, and gross margins to help investors assess a company's financial performance and potential.
FCF Yield analysis provides insights into a company's cash flow efficiency by measuring free cash flow relative to enterprise value and tracking percentage changes.
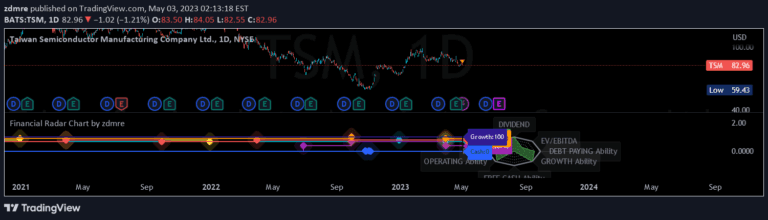
A comprehensive financial analysis radar chart that evaluates multiple key performance indicators to assess a company's financial health and investment potential.
A comprehensive quarterly earnings tracker that helps investors identify potential multibagger stocks by analyzing financial performance, growth metrics, and technical positioning.
A trading signal that displays performance metrics for Japanese companies in a tabular format, providing comprehensive insights into financial performance and potential investment opportunities.
Scale Ability indicator assesses a company's growth potential by analyzing financial ratios that demonstrate efficiency in resource utilization and revenue generation.
Likes, views, and comments are historical TradingView snapshots. They describe attention, not trading performance.