RSI cyclic smoothed v2
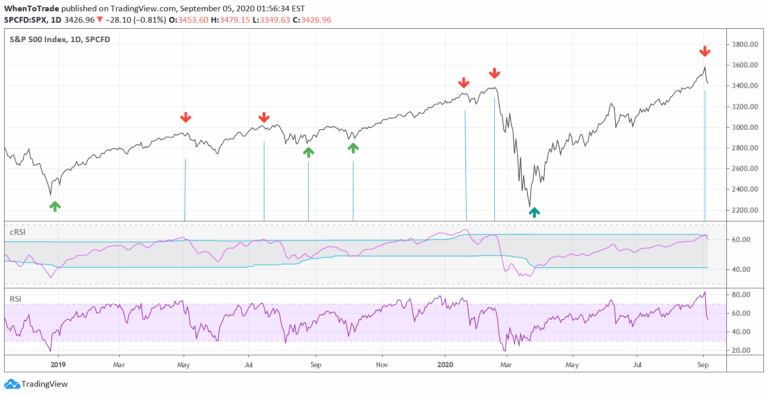
An enhanced RSI indicator that uses cyclic smoothing and adaptive bands to provide more responsive market trend signals by incorporating dominant cycle length.
Explore 11,183 indicators. Filter beyond the obvious.
Discover the tools that fit the way you trade.
11,183 tools to explore
An enhanced RSI indicator that uses cyclic smoothing and adaptive bands to provide more responsive market trend signals by incorporating dominant cycle length.
A sophisticated market cycle detection method that uses Detrended Price Oscillator to identify rhythmic patterns and dominant cycles in price movements, helping traders optimize technical indicator settings.
A modified On Balance Volume (OBV) indicator that adds smoothing techniques and a signal line to help traders identify potential entry and exit points in financial markets.
An adaptive momentum oscillator using Hilbert Transform to detect market cycles and provide dynamic insights into trend shifts, overbought/oversold conditions, and potential price reversals.
The Active Address Sentiment Oscillator (AASO) analyzes Bitcoin's daily active addresses and price returns to provide a macro sentiment indicator for potential market valuation and trend shifts.
An advanced volume analysis tool that measures volume density across multiple assets, providing insights into market maker activities and liquidity concentration in trading markets.
A sophisticated technical indicator using Fibonacci sequence numbers to create dynamic moving average channels that help traders identify trend direction, potential support/resistance zones, and trade entry points.
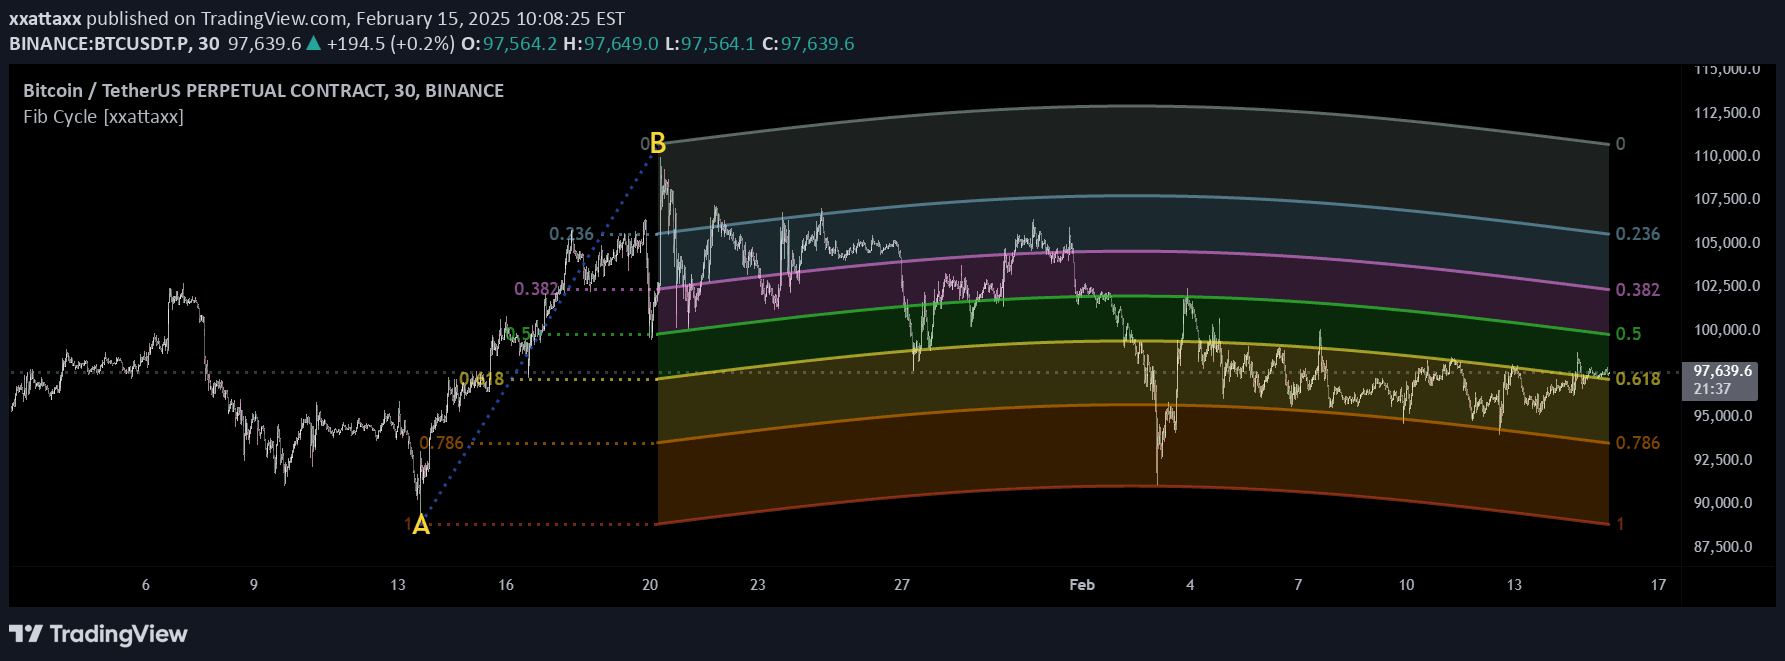
A dynamic Fibonacci analysis tool that transforms traditional retracement levels into wave-based cycles, offering a non-linear approach to understanding market structure and price movements.
The Composite Manipulation Index (CMI) is a market integrity tool that quantifies structural chaos by analyzing price behavior's predictability and rhythmic deviation to detect potential market manipulation.
A time series filter using EMA to reduce lag in market data analysis. It helps traders minimize delay in trend identification by adjusting the lag reduction parameter.
Bar Strength Index (BSI) is a unique momentum indicator derived from Internal Bar Strength, offering insights into price movement and potential trend shifts similar to RSI but with a different calculation method.
A trading signal that tracks consecutive lower highs and higher lows to indicate potential market retracements or run-on-stops by monitoring pivot point sequences.
Likes, views, and comments are historical TradingView snapshots. They describe attention, not trading performance.