RSI Trail [UAlgo]
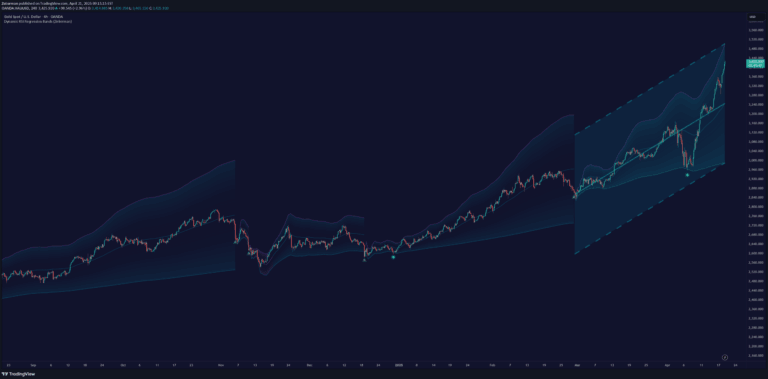
RSI Trail is a technical analysis tool that uses Relative Strength Index and moving averages to dynamically plot support and resistance levels, helping traders identify market trends and potential entry/exit points.
Explore 11,183 indicators. Filter beyond the obvious.
Discover the tools that fit the way you trade.
11,183 tools to explore
RSI Trail is a technical analysis tool that uses Relative Strength Index and moving averages to dynamically plot support and resistance levels, helping traders identify market trends and potential entry/exit points.
A unique RSI indicator that transforms traditional RSI into candlesticks, providing deeper insights into price action and momentum through advanced visualization techniques.
A dynamic RSI-based regression channel that adapts to market momentum by resetting its trend analysis when RSI crosses overbought or oversold levels, revealing potential trend shifts.
A trading indicator combining engulfing candle patterns with RSI to identify potential market reversals and momentum shifts, providing clear visual signals for entry and exit points.
RSI Chart Levels overlay helps identify support/resistance zones and real-time divergence by tracking price movements against RSI indicator fluctuations.
A custom RSI indicator that visualizes overbought and oversold levels using color-coded bands, allowing traders to identify potential trend reversals more intuitively.
A custom trading indicator using two RSI bands to analyze price momentum across different timeframes, providing insights into potential market entry and exit points through crossover signals.
A custom trading indicator using RSI and SMA to generate buy, sell, and reversal signals by analyzing price momentum and moving average trends.
RSI OB/OS Strategy Analyzer helps traders identify overbought/oversold market conditions by calculating Relative Strength Index and generating performance metrics for potential mean-reversion trades.
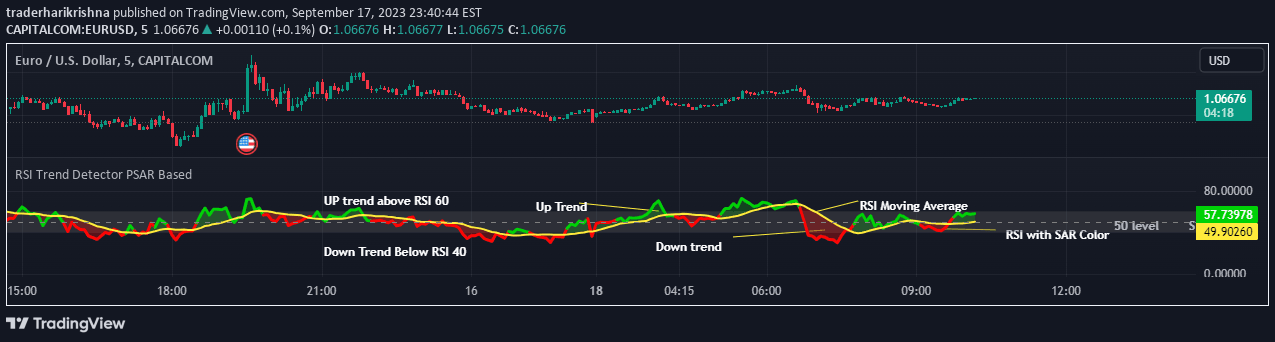
RSI Trend Detector combines RSI with PSAR to identify market trend direction, providing clear signals for entry points and trend strength using color-coded indicators.
A multi-timeframe trading tool combining EMA, VWAP, RSI, and MACD to generate buy and sell signals across scalping and swing trading strategies.
A multi-feature trading indicator combining Bollinger Bands, RSI, trend continuation patterns, and exhaustion signals to help traders identify potential market entry and exit points.
Likes, views, and comments are historical TradingView snapshots. They describe attention, not trading performance.