
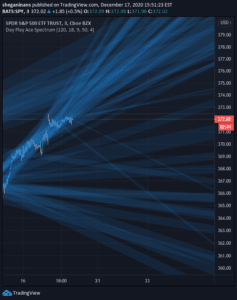
Daily Play Ace Spectrum
Daily Play Ace Spectrum is an advanced, configurable trading indicator extending the original Ace Spectrum with more parameters for enhanced sensitivity and adaptability across shorter timeframes.
Explore 11,183 indicators. Filter beyond the obvious.
Discover the tools that fit the way you trade.
11,183 tools to explore
Daily Play Ace Spectrum is an advanced, configurable trading indicator extending the original Ace Spectrum with more parameters for enhanced sensitivity and adaptability across shorter timeframes.
An advanced cycle period detector that analyzes market data spectral estimates to identify dominant cycles and frequencies in price action, providing insights into market rhythms and potential trend movements.
Endpointed SSA of Price uses advanced time series decomposition to analyze financial markets, revealing hidden trends and potential trading signals through sophisticated mathematical techniques.
A color-coded indicator that tracks the number of price bars with higher closing prices, revealing historical price strength and potential trend dynamics.
A comprehensive trend analysis tool using multiple Simple Moving Averages to create a color-coded spectrum that visualizes market momentum and trend strength across different time frames.
A crypto trading indicator that compares spot and futures market prices, helping traders identify price divergences and potential arbitrage opportunities in cryptocurrency markets.
Volume Spectrum analyzes trading volume patterns across financial markets, offering insights into volume dynamics and potential price movement trends.
A customizable indicator that plots horizontal and vertical lines at specific times, allowing traders to mark important market sessions like equity market opening ranges.
Volatility Spectrum is an advanced technical indicator that provides nuanced market volatility analysis through customizable Average True Range (ATR) measurements and dynamic visual representations.
Full Spectrum Delta Bands provide a comprehensive market analysis tool that extends beyond traditional Bollinger Bands by incorporating full OHLC data for more accurate trend and volatility insights.
A Gaussian distribution-based tool that visualizes price volatility and detects potential market breakouts through dynamic spectrum analysis and customizable alert thresholds.
Volume Spectrum Candles is a unique trading indicator that enhances candlestick charts by visually representing trading volume through color gradation, enabling quick market activity analysis.
Likes, views, and comments are historical TradingView snapshots. They describe attention, not trading performance.