Breakout Probability (Expo)
Breakout Probability indicator calculates the likelihood of new market highs or lows by analyzing historical price action and displaying percentage probabilities for potential price levels.
Explore 11,183 indicators. Filter beyond the obvious.
Discover the tools that fit the way you trade.
11,183 tools to explore
Breakout Probability indicator calculates the likelihood of new market highs or lows by analyzing historical price action and displaying percentage probabilities for potential price levels.
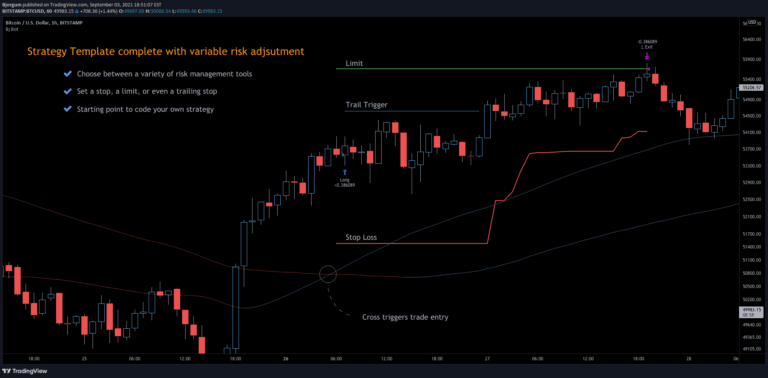
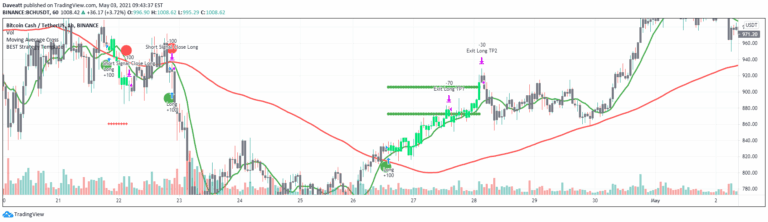
A 3Commas TradingView bot strategy offering automated trading with risk management, using moving average crossovers and customizable stop-loss and limit order settings.
A universal strategy template for TradingView that allows traders to convert any indicator into a tradable strategy with comprehensive risk management and backtesting features.
An advanced stop-loss strategy that uses volume, price, and volatility to dynamically adjust stop-loss levels, helping traders manage risk by considering individual security characteristics.
A trailing stop strategy that uses market structure like Change of Character (CHoCH) and Break of Structure (BOS) to dynamically adjust stop-loss levels for protecting profits.
An advanced Opening Range Breakout (ORB) indicator that analyzes market trends in the first session minutes, providing precise entry, take-profit, and stop-loss signals.
A liquidity indicator that identifies potential market order zones by mapping swing highs and lows, revealing where stop-loss orders and significant liquidity pools are likely positioned.
Wolfe Pattern is a trading strategy that identifies potential trend reversals by analyzing a specific wedge formation and drawing lines connecting key pivot points to determine entry and exit signals.
A comprehensive harmonic pattern recognition tool that identifies multiple chart patterns using zigzag indicators, helping traders detect potential trend reversals and continuation signals.
Fair value bands assess price behavior by tracking deviations from a mean basis, helping traders identify normal and abnormal price movements through dynamic statistical bands.
Session Sweeps indicator identifies liquidity pools and market shifts across major trading sessions, using session highs/lows to detect potential trend changes and entry points.
An advanced trading indicator using ICT's Power Of Three strategy to detect smart money movements through accumulation, manipulation, and distribution phases.
Likes, views, and comments are historical TradingView snapshots. They describe attention, not trading performance.